
How made money in
How does Apple make money? This Sankey traces every dollar of revenue through the income statement — into cost of revenue, R&D, SG&A, and taxes — and shows what's left as profit. Pick any fiscal year. Straight from SEC filings.
Each fiscal year from SEC filings. Percentages are share of revenue, so the green profit nodes read directly as gross / operating / net margin. Line items a company doesn't break out are derived from their siblings so the flows balance; small residuals show as “Other.” For informational purposes only.
More visualizations
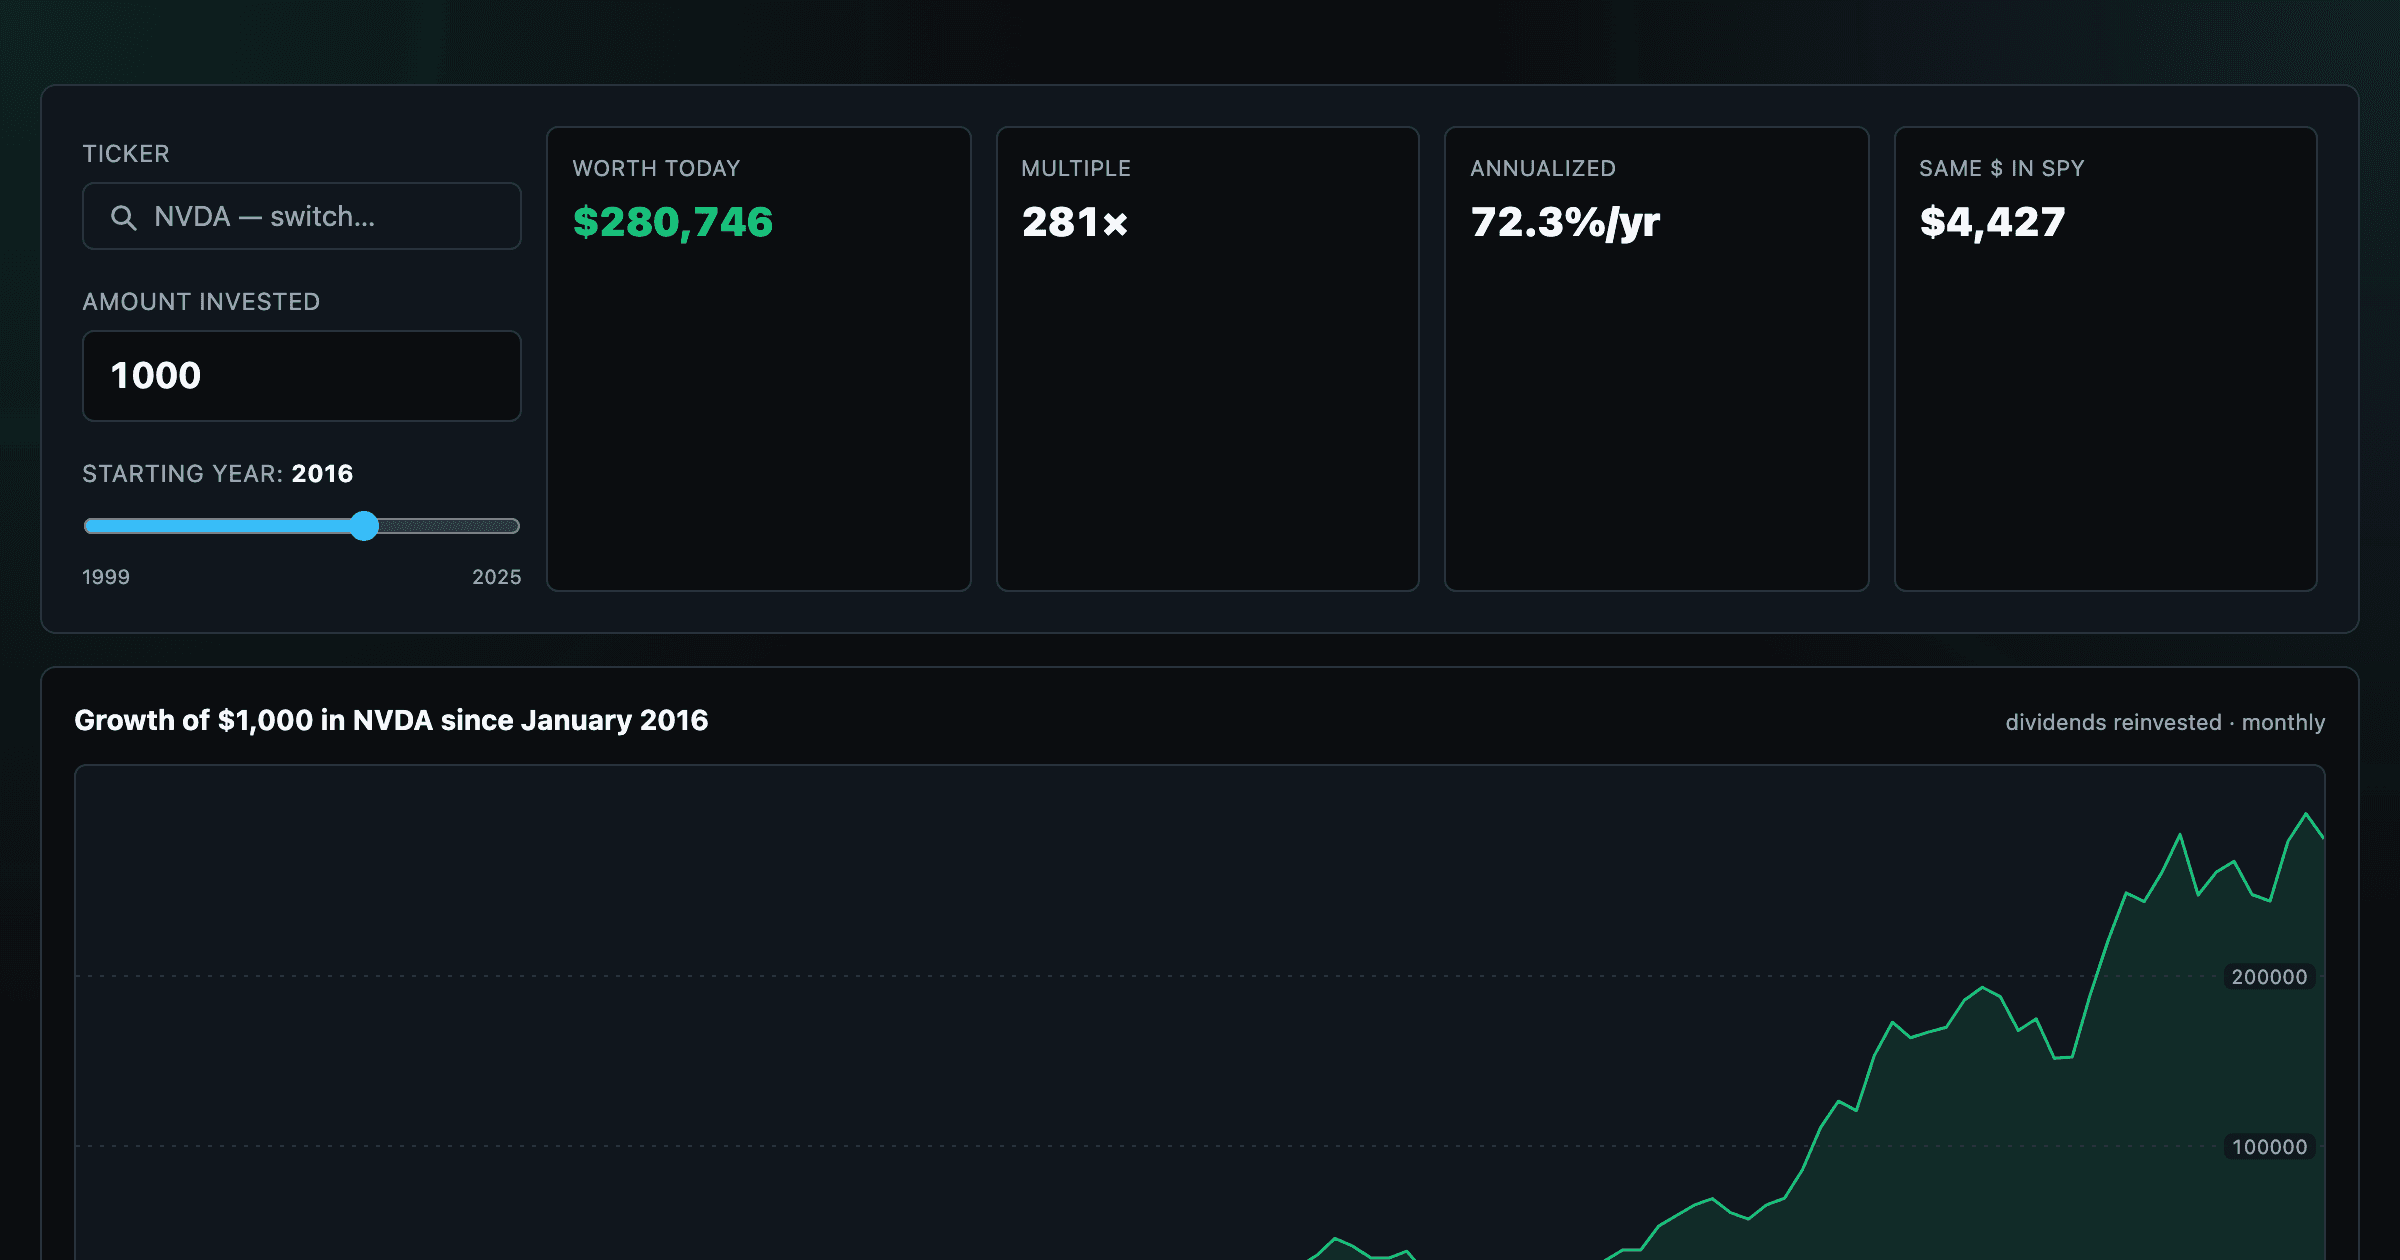
What $1,000 in any stock or ETF would be worth today.
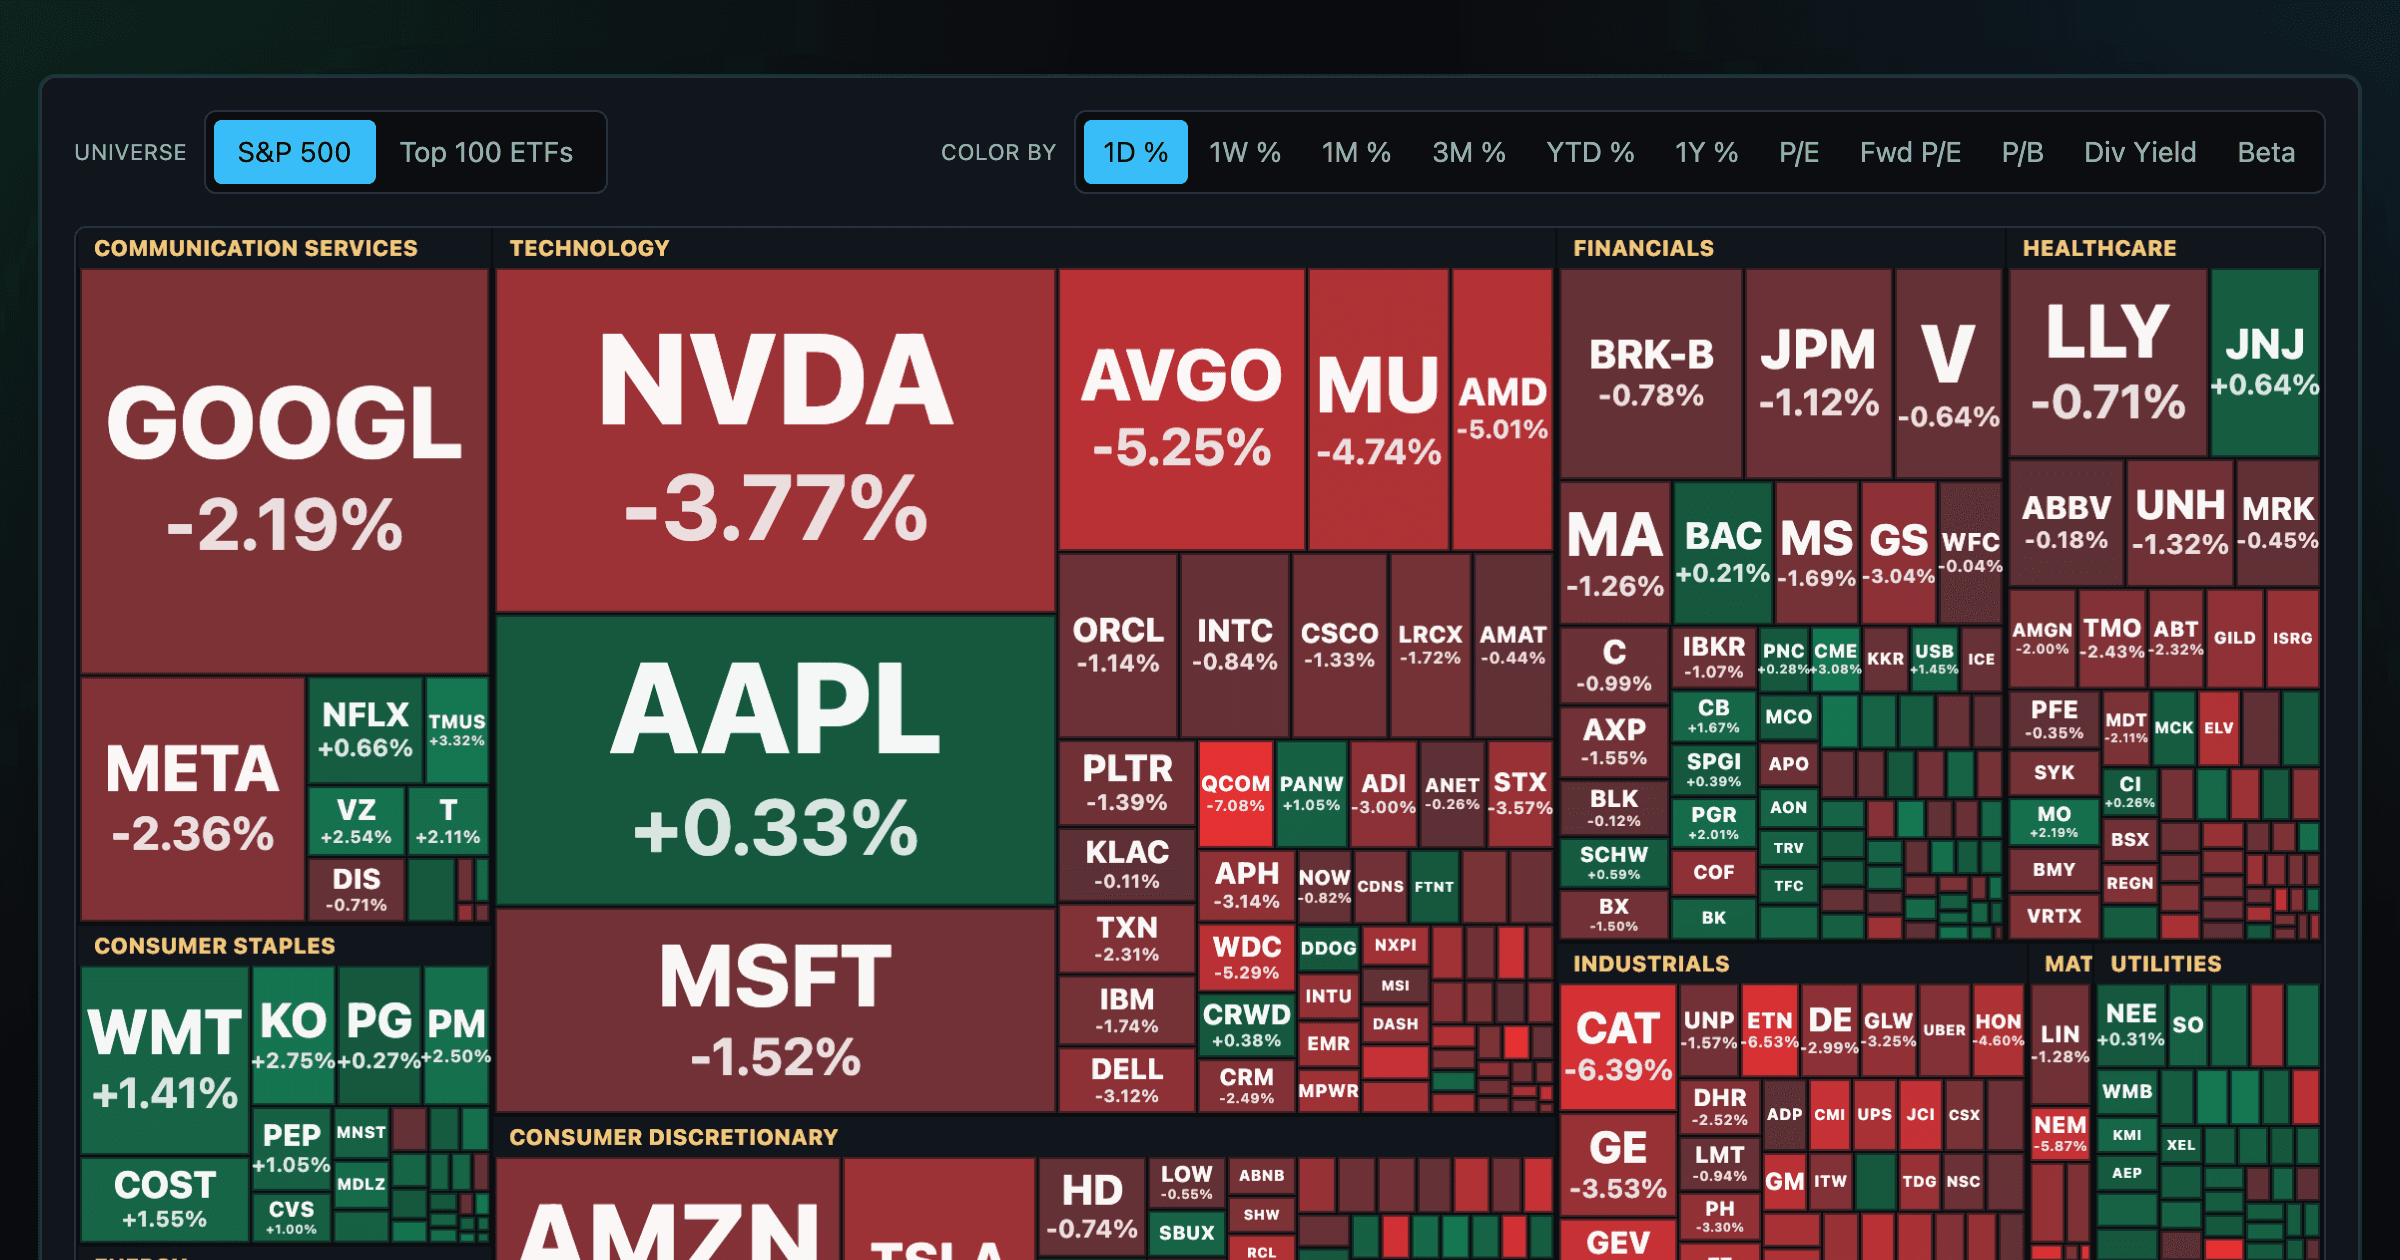
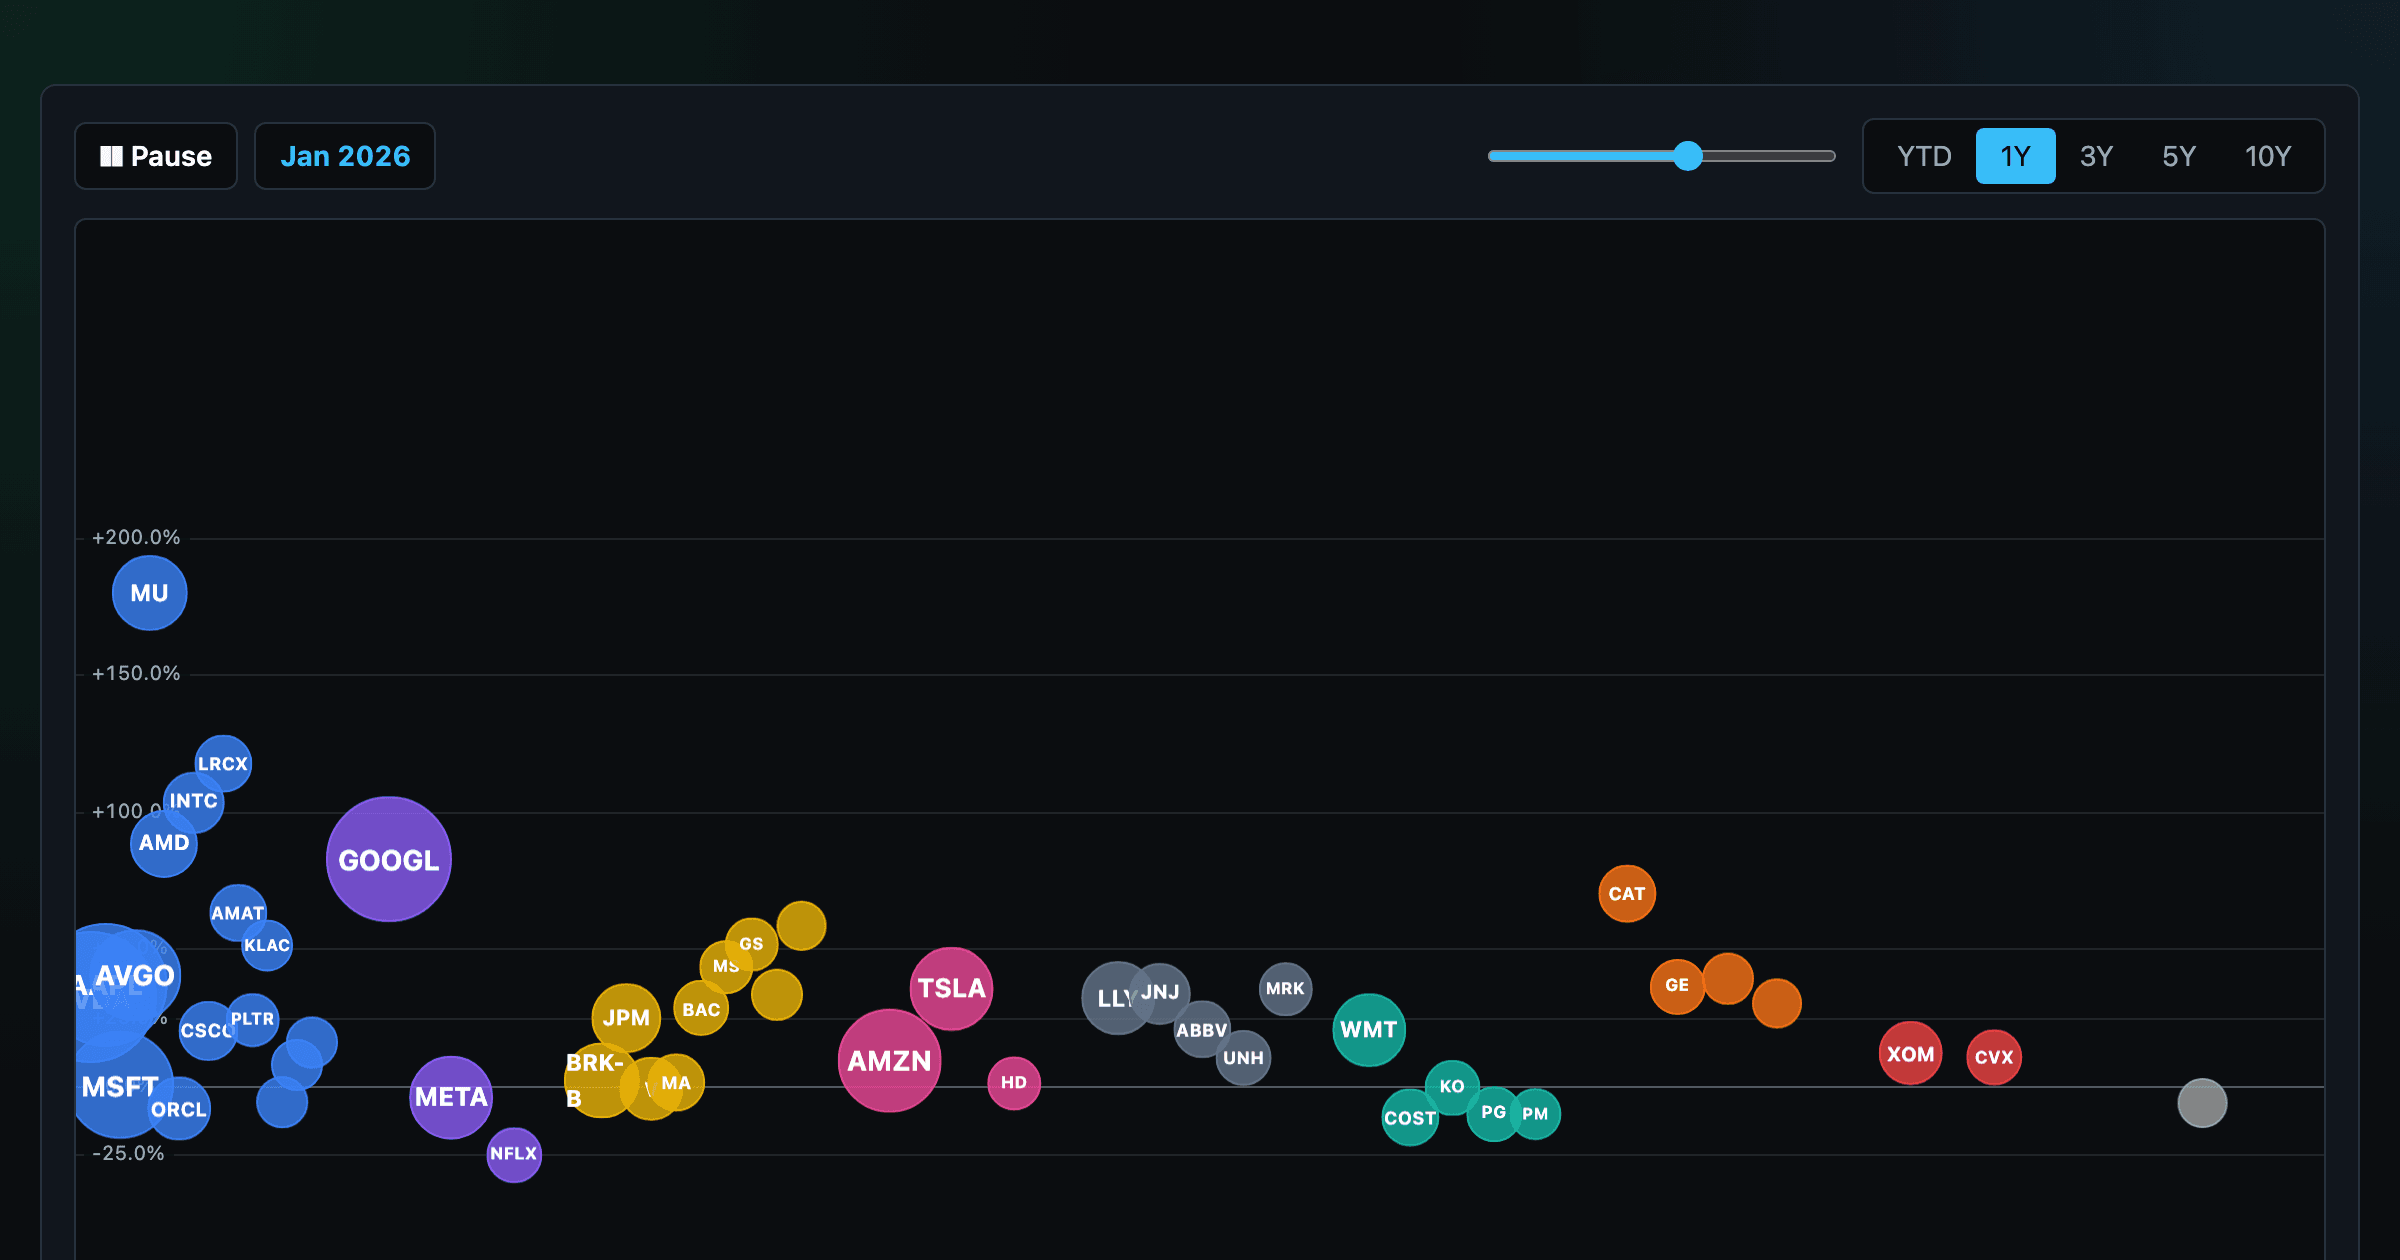
Every S&P 500 company sized by market cap — color by return or valuation.
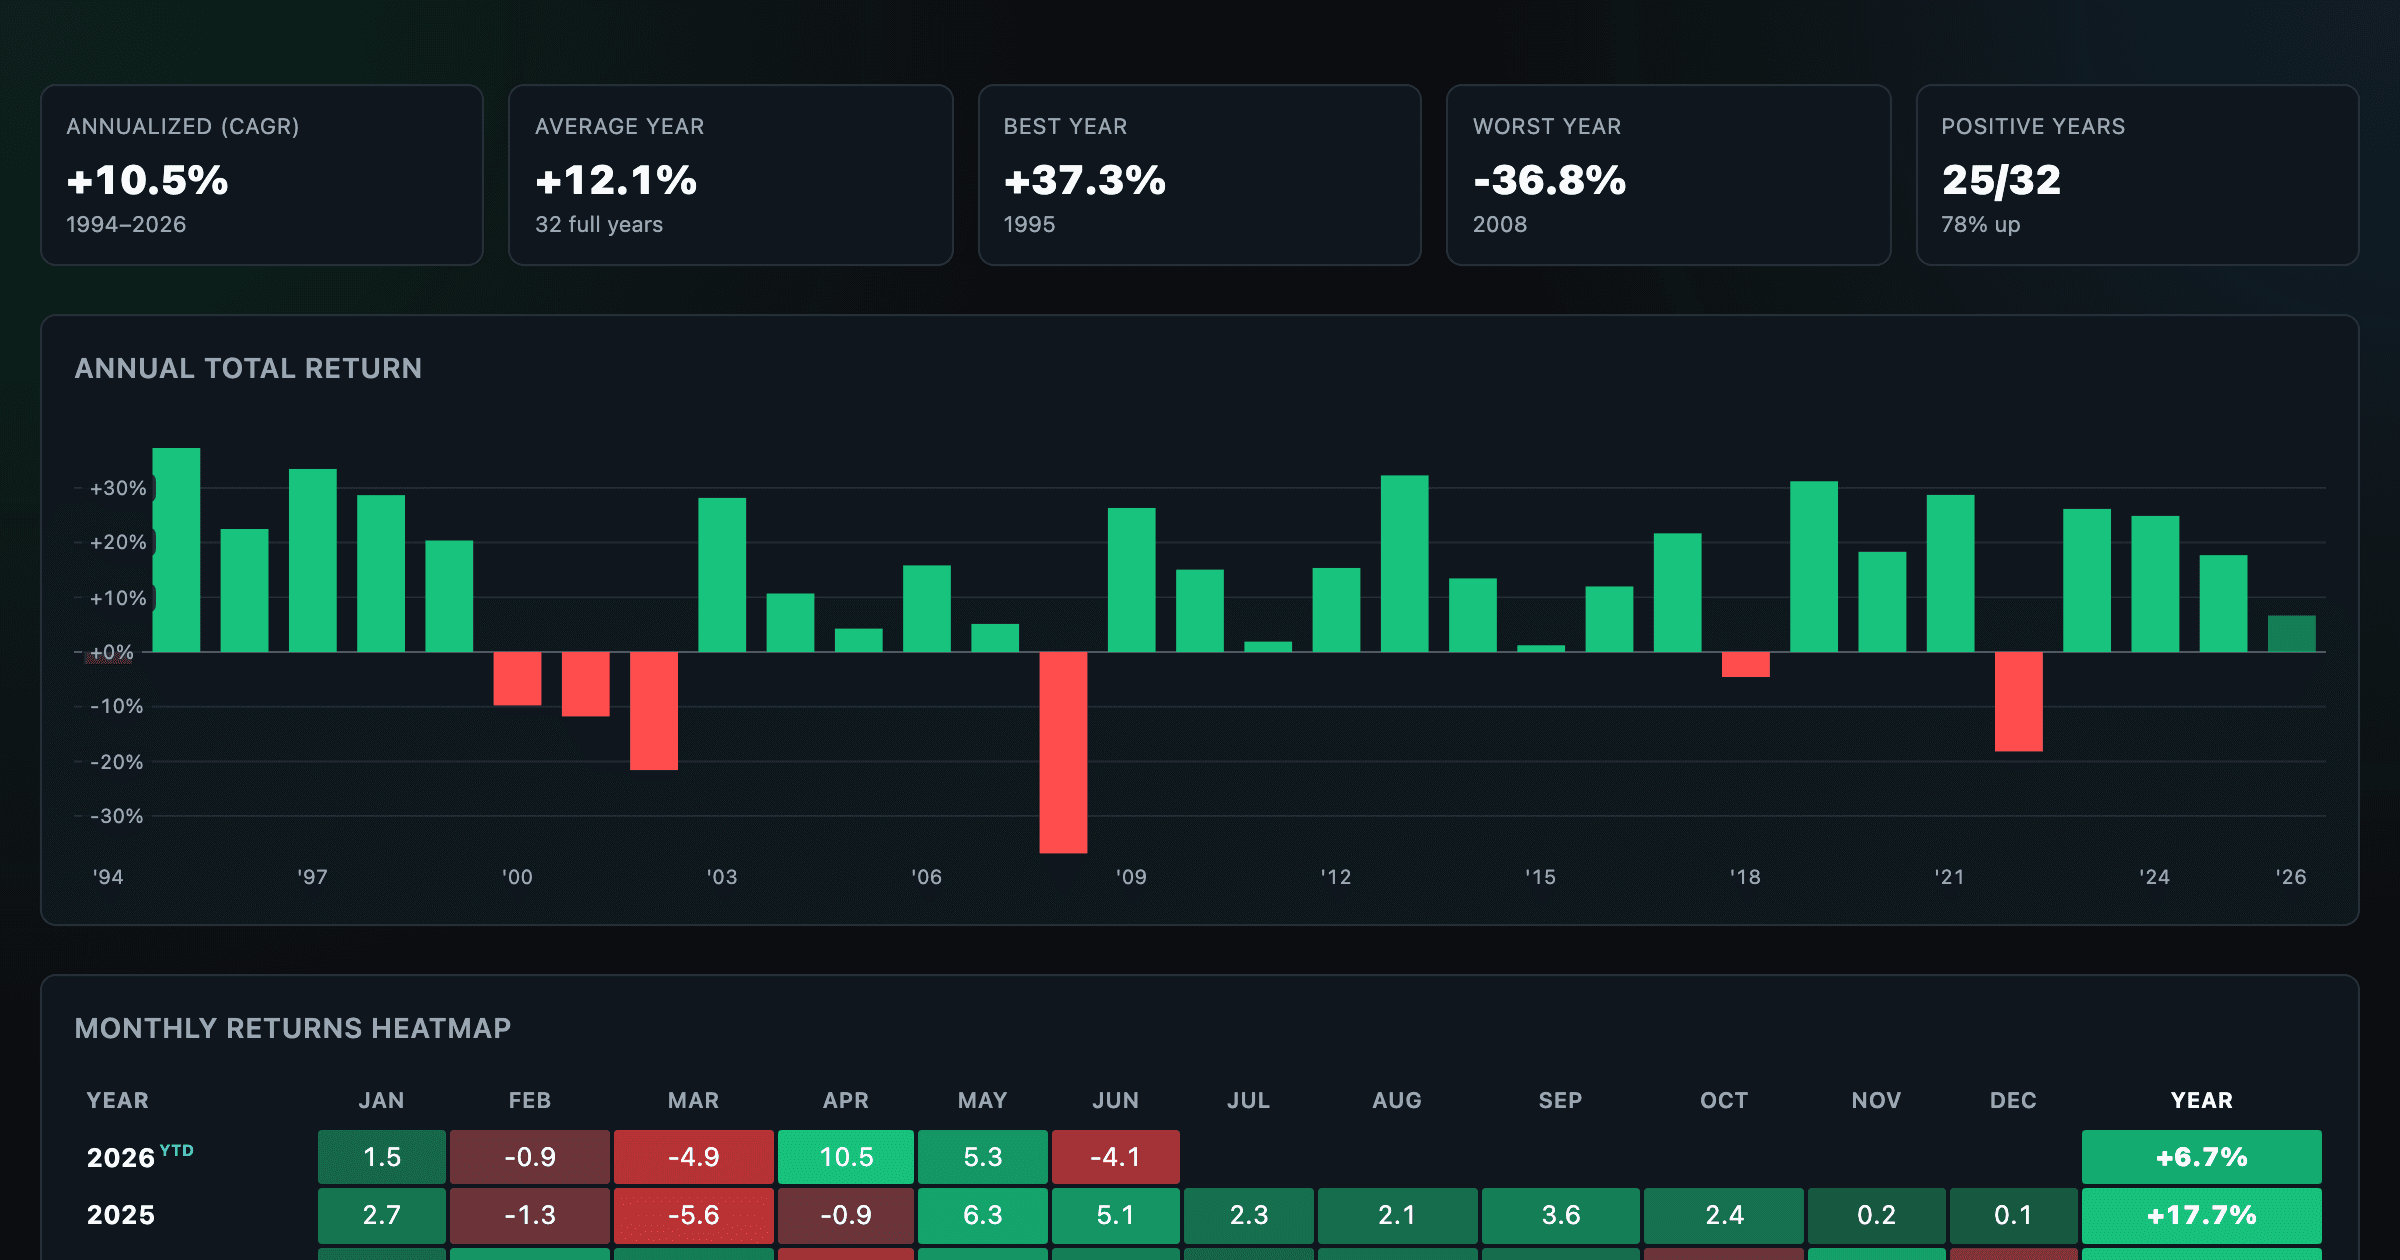
S&P 500 annual and monthly returns — every year, every month.
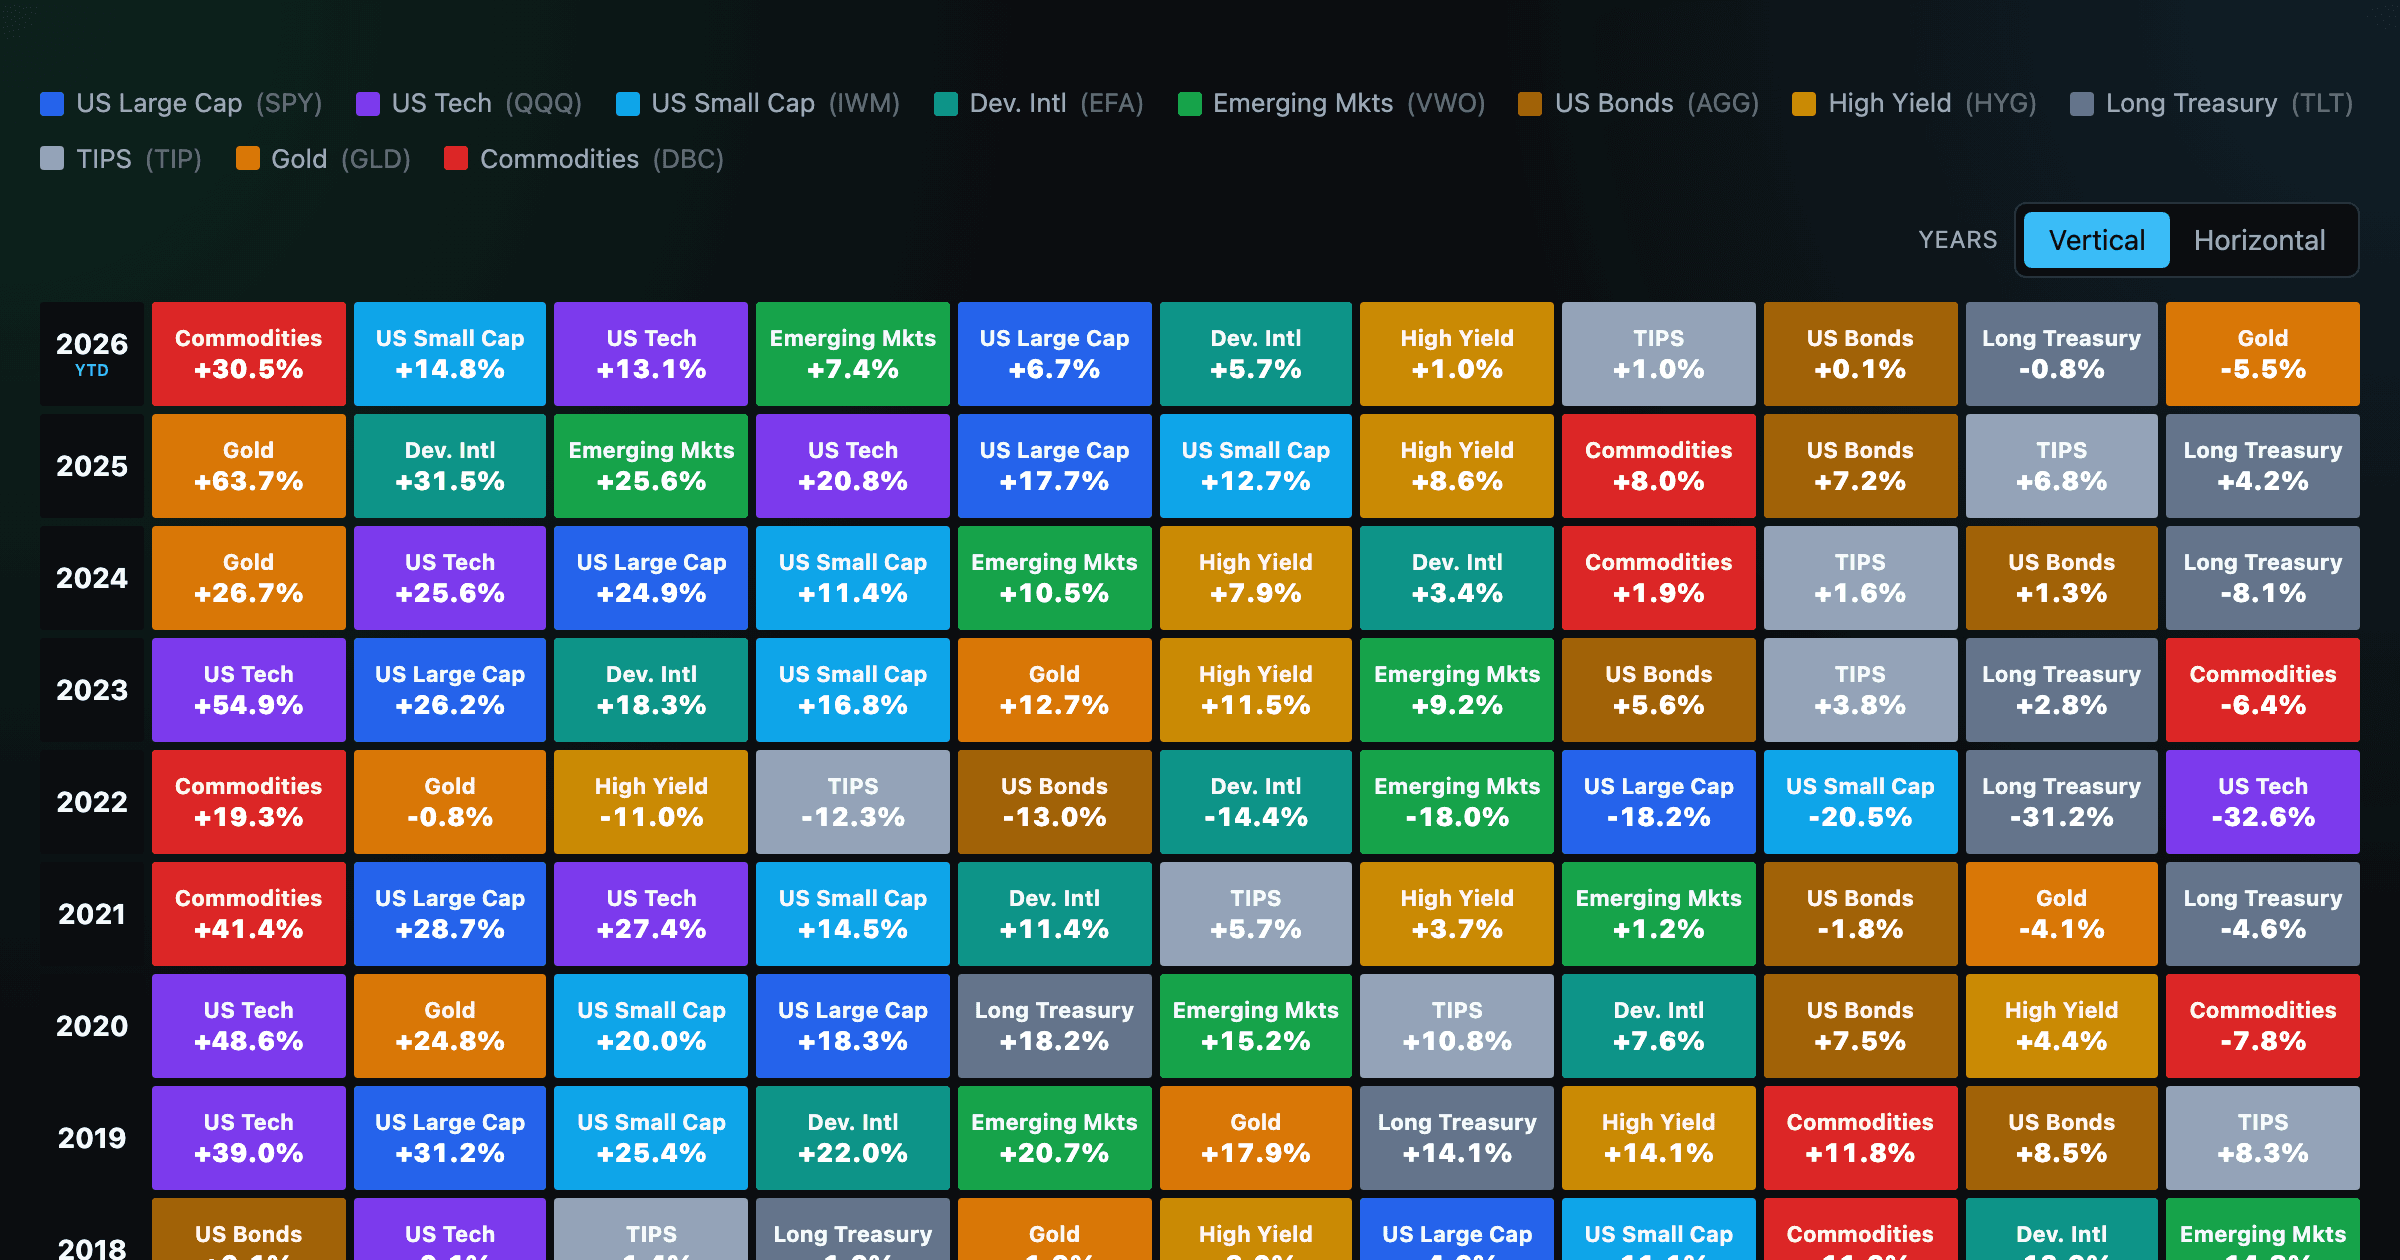
Asset-class returns ranked year by year — the Callan chart / asset allocation quilt.
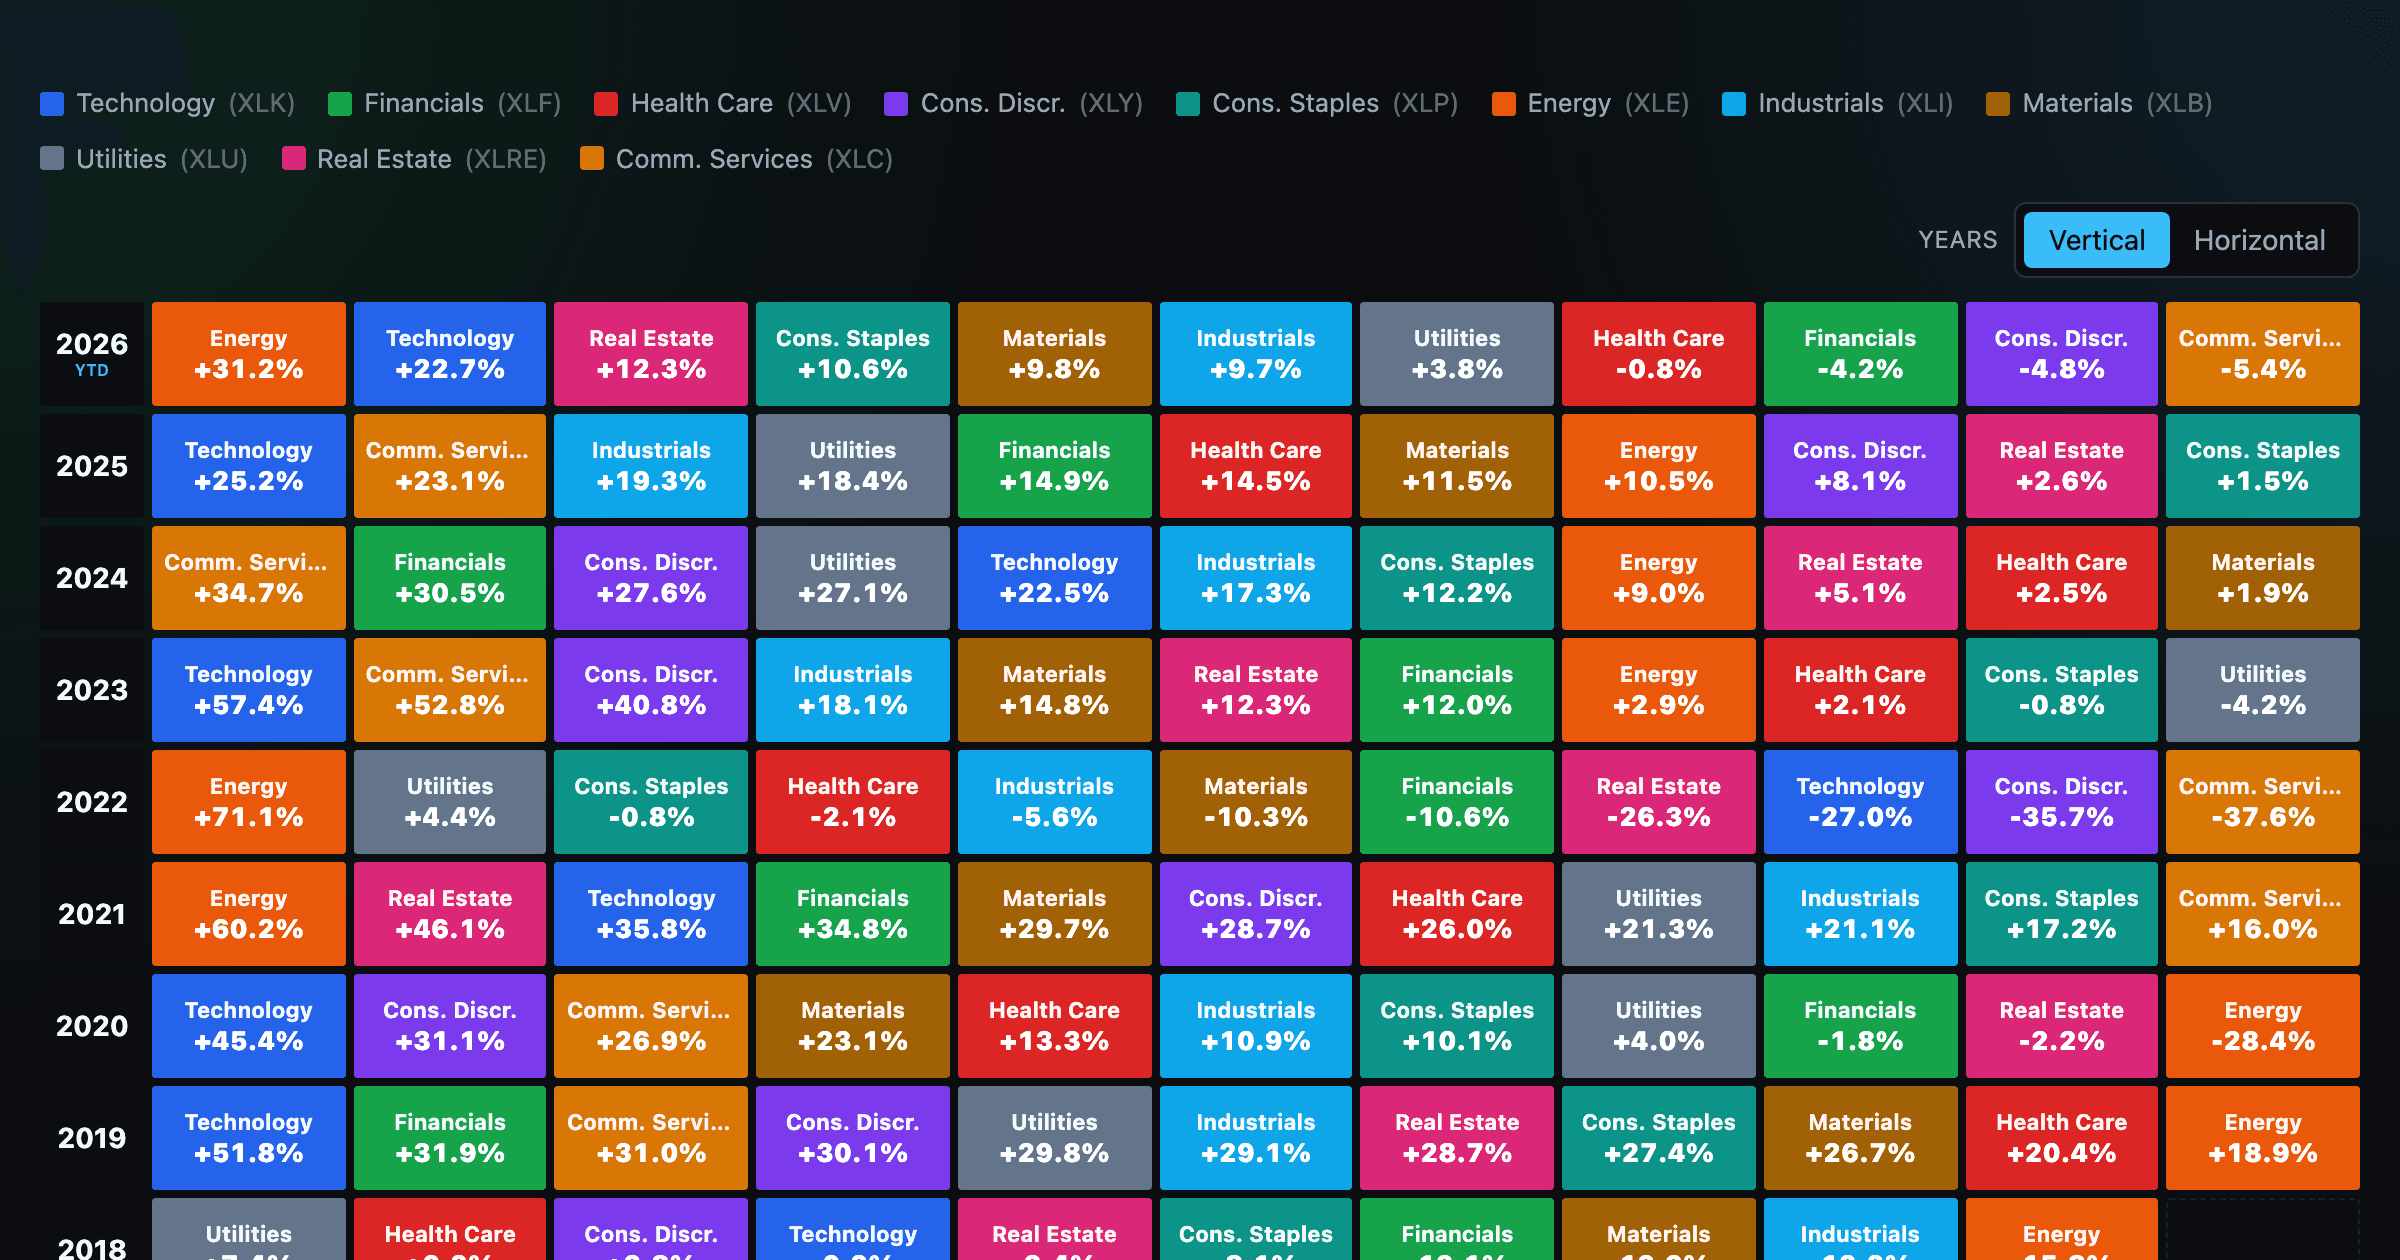
The 11 S&P 500 sectors ranked year by year — a sector quilt chart, back to 1999.
The biggest US companies as animated bubbles, rising and falling with their total return over time.
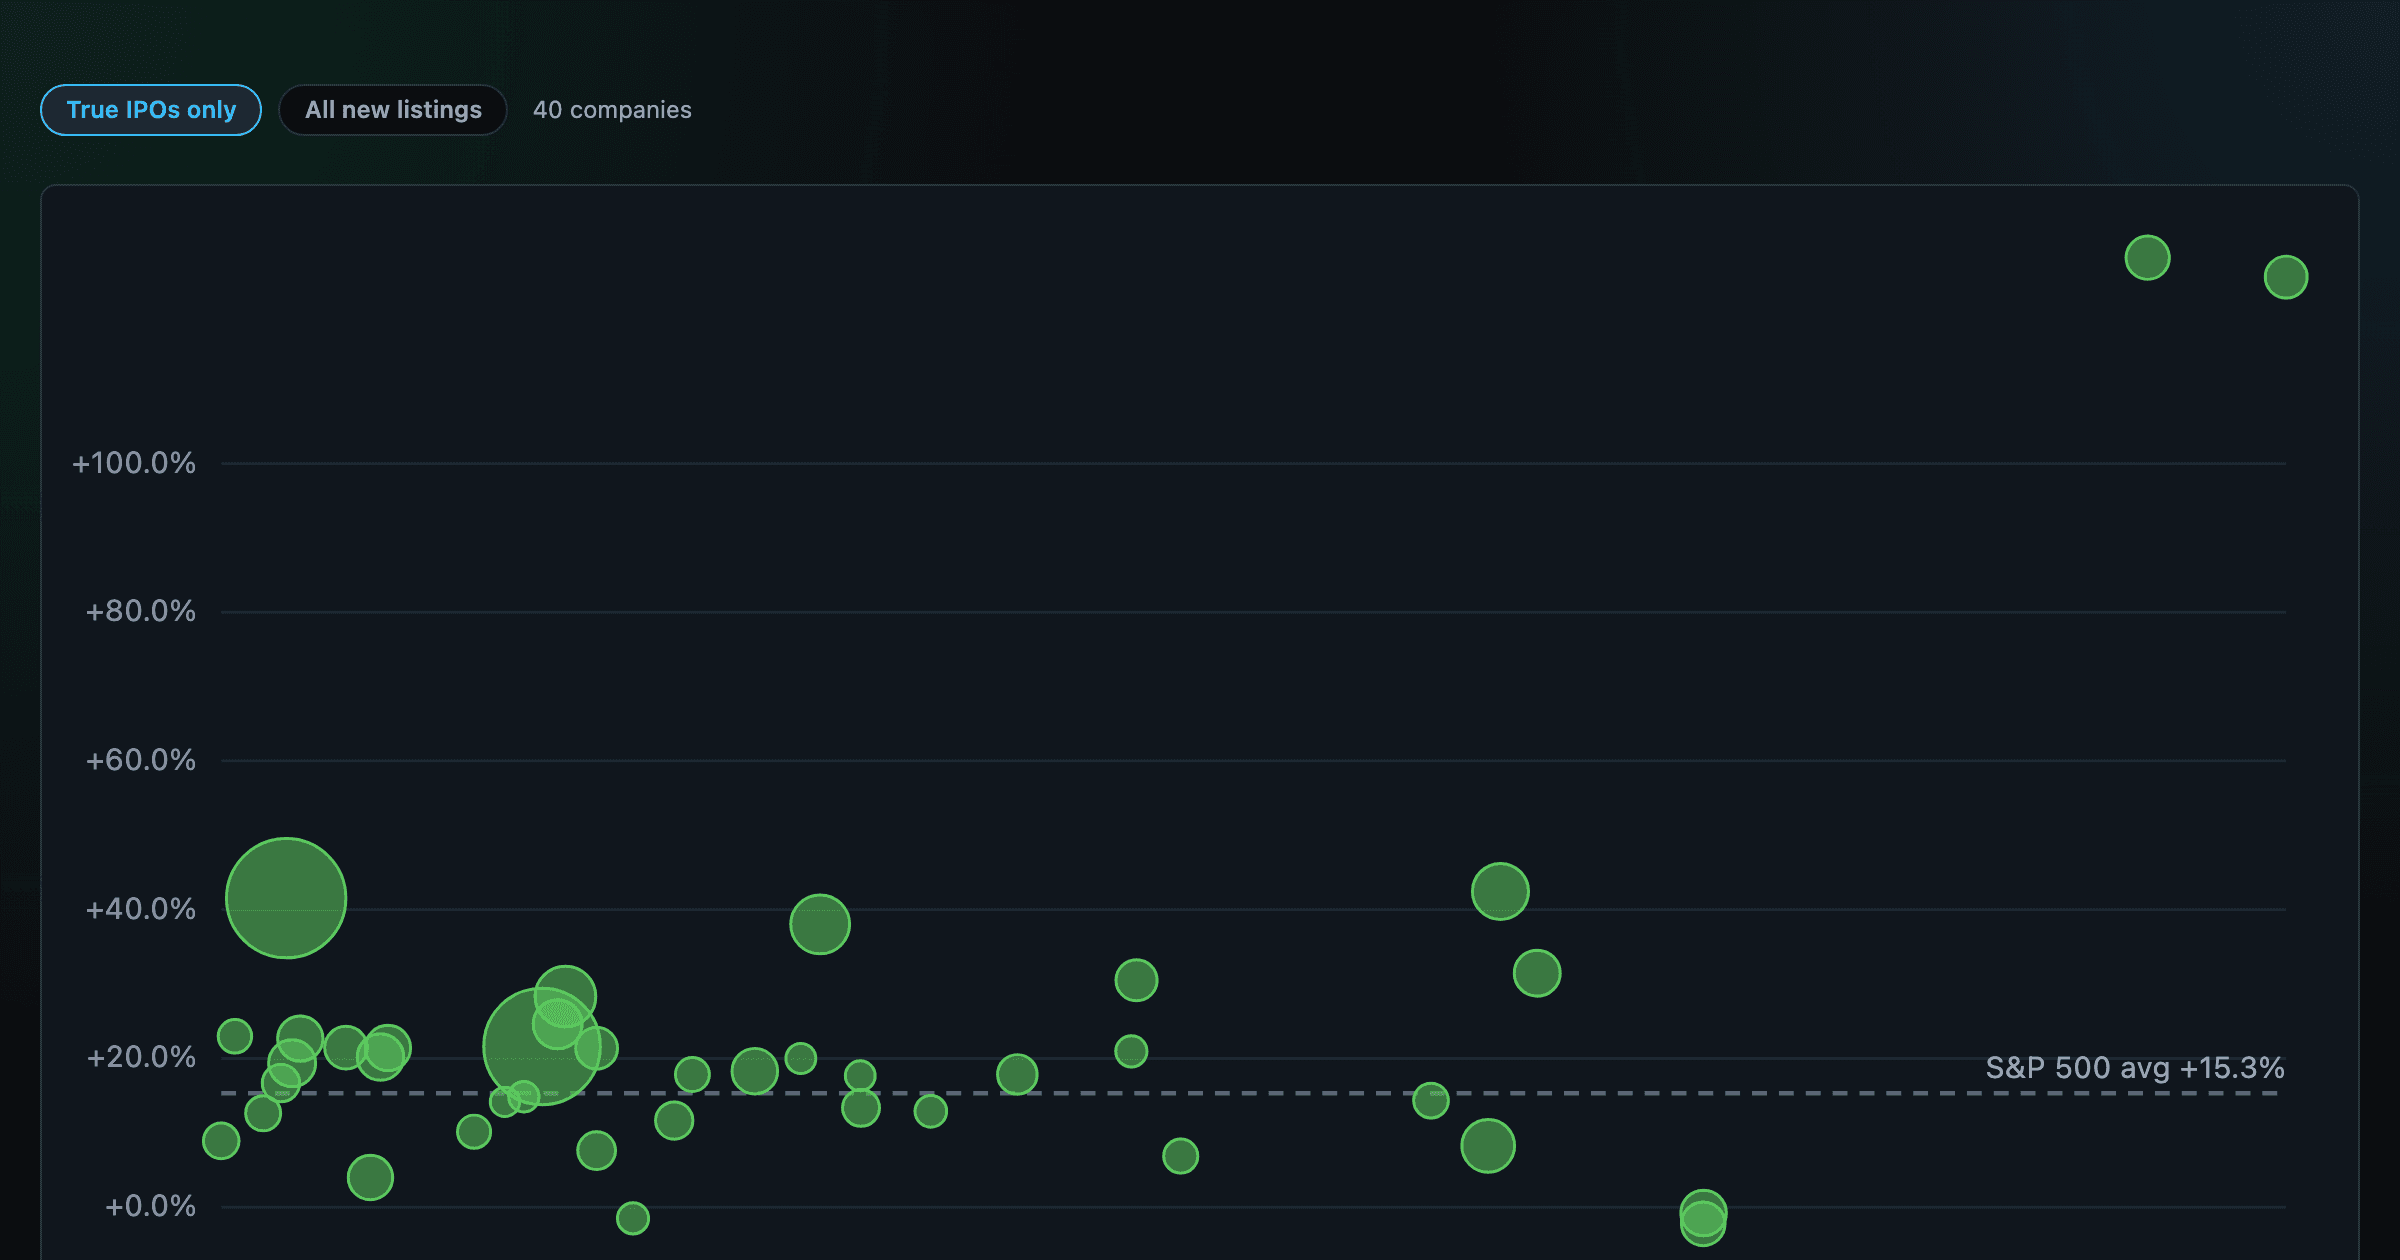
How recent stock-market debuts have performed since listing — annualized, vs the S&P 500, by IPO vs spin-off.
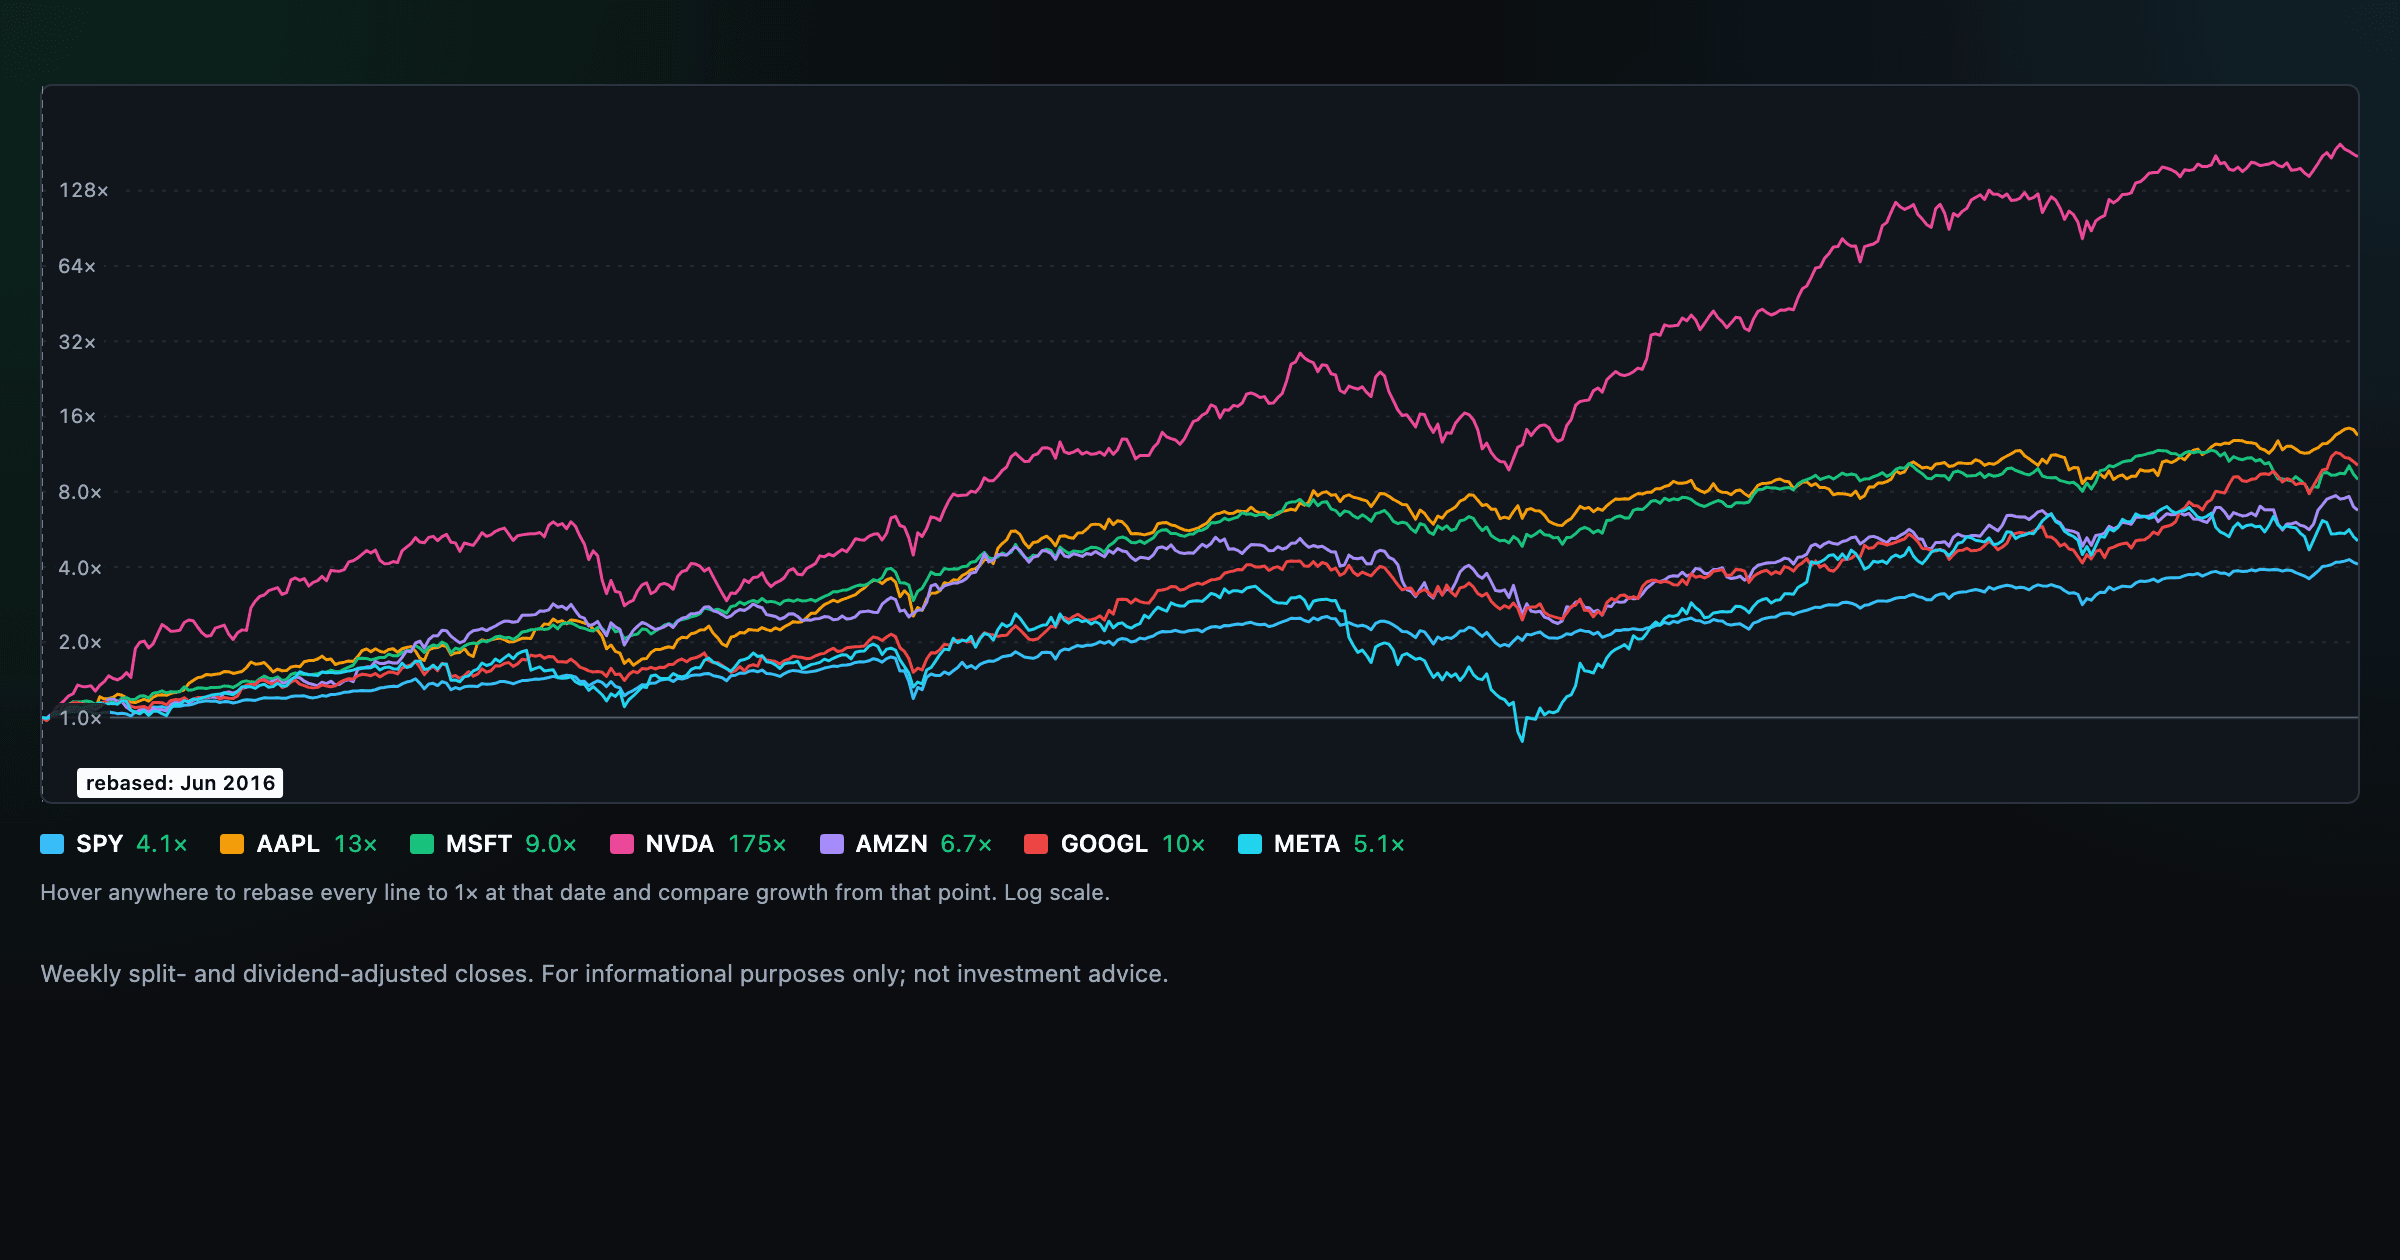
Compare megacaps vs the S&P 500, rebased to 1× at any date you hover.
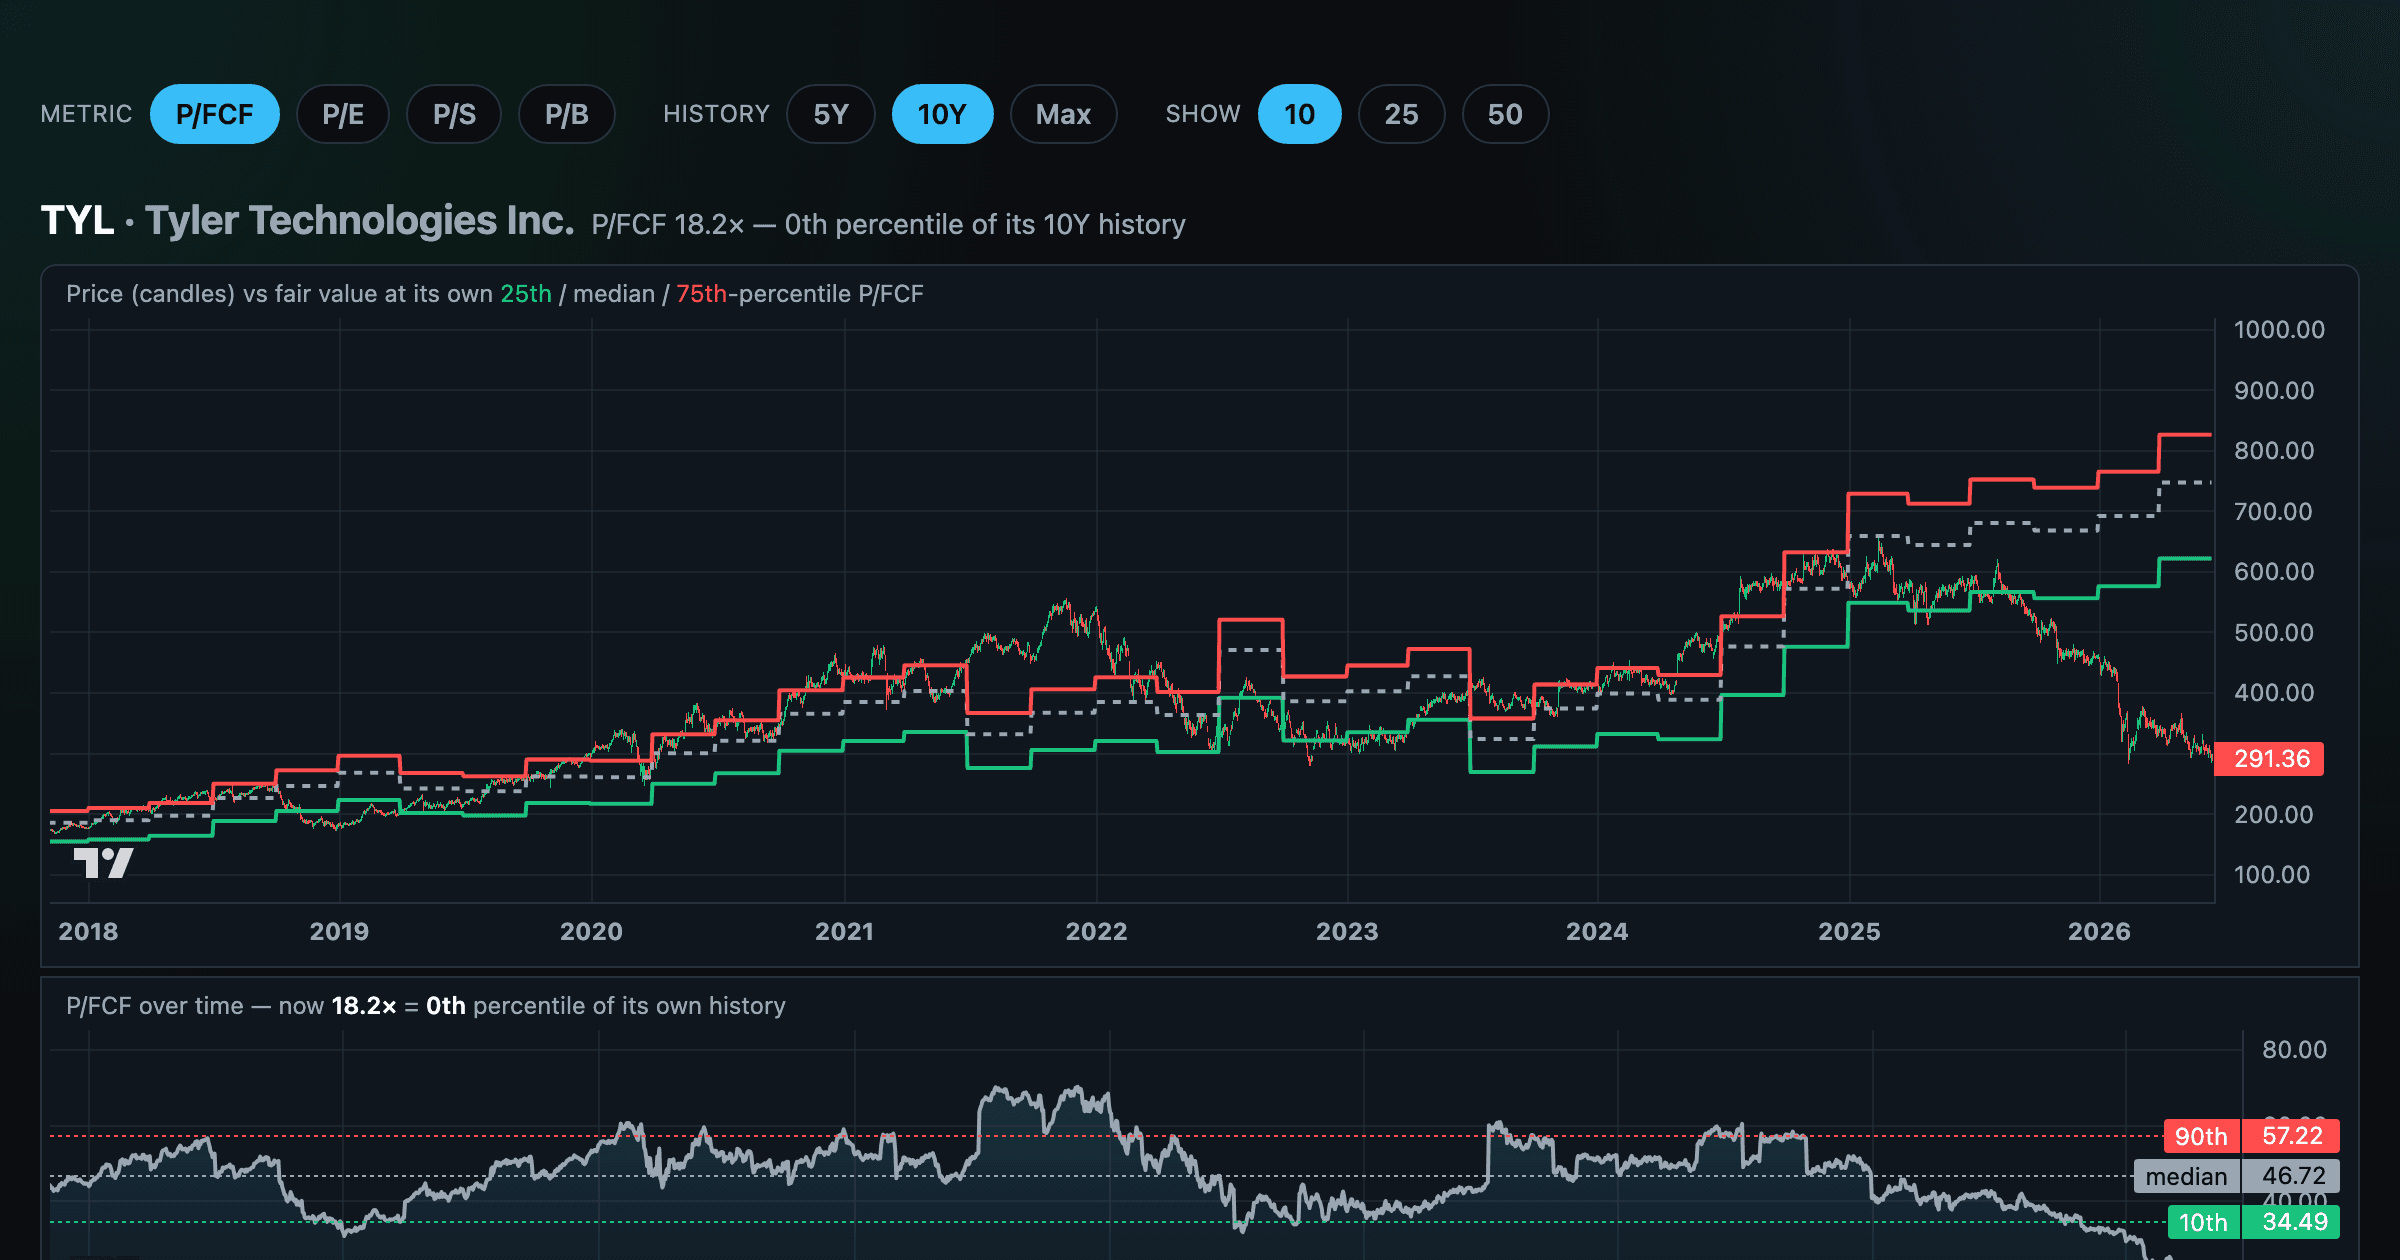
Stocks trading cheapest relative to their own P/E, P/FCF, P/S, or P/B history — with fair-value bands.
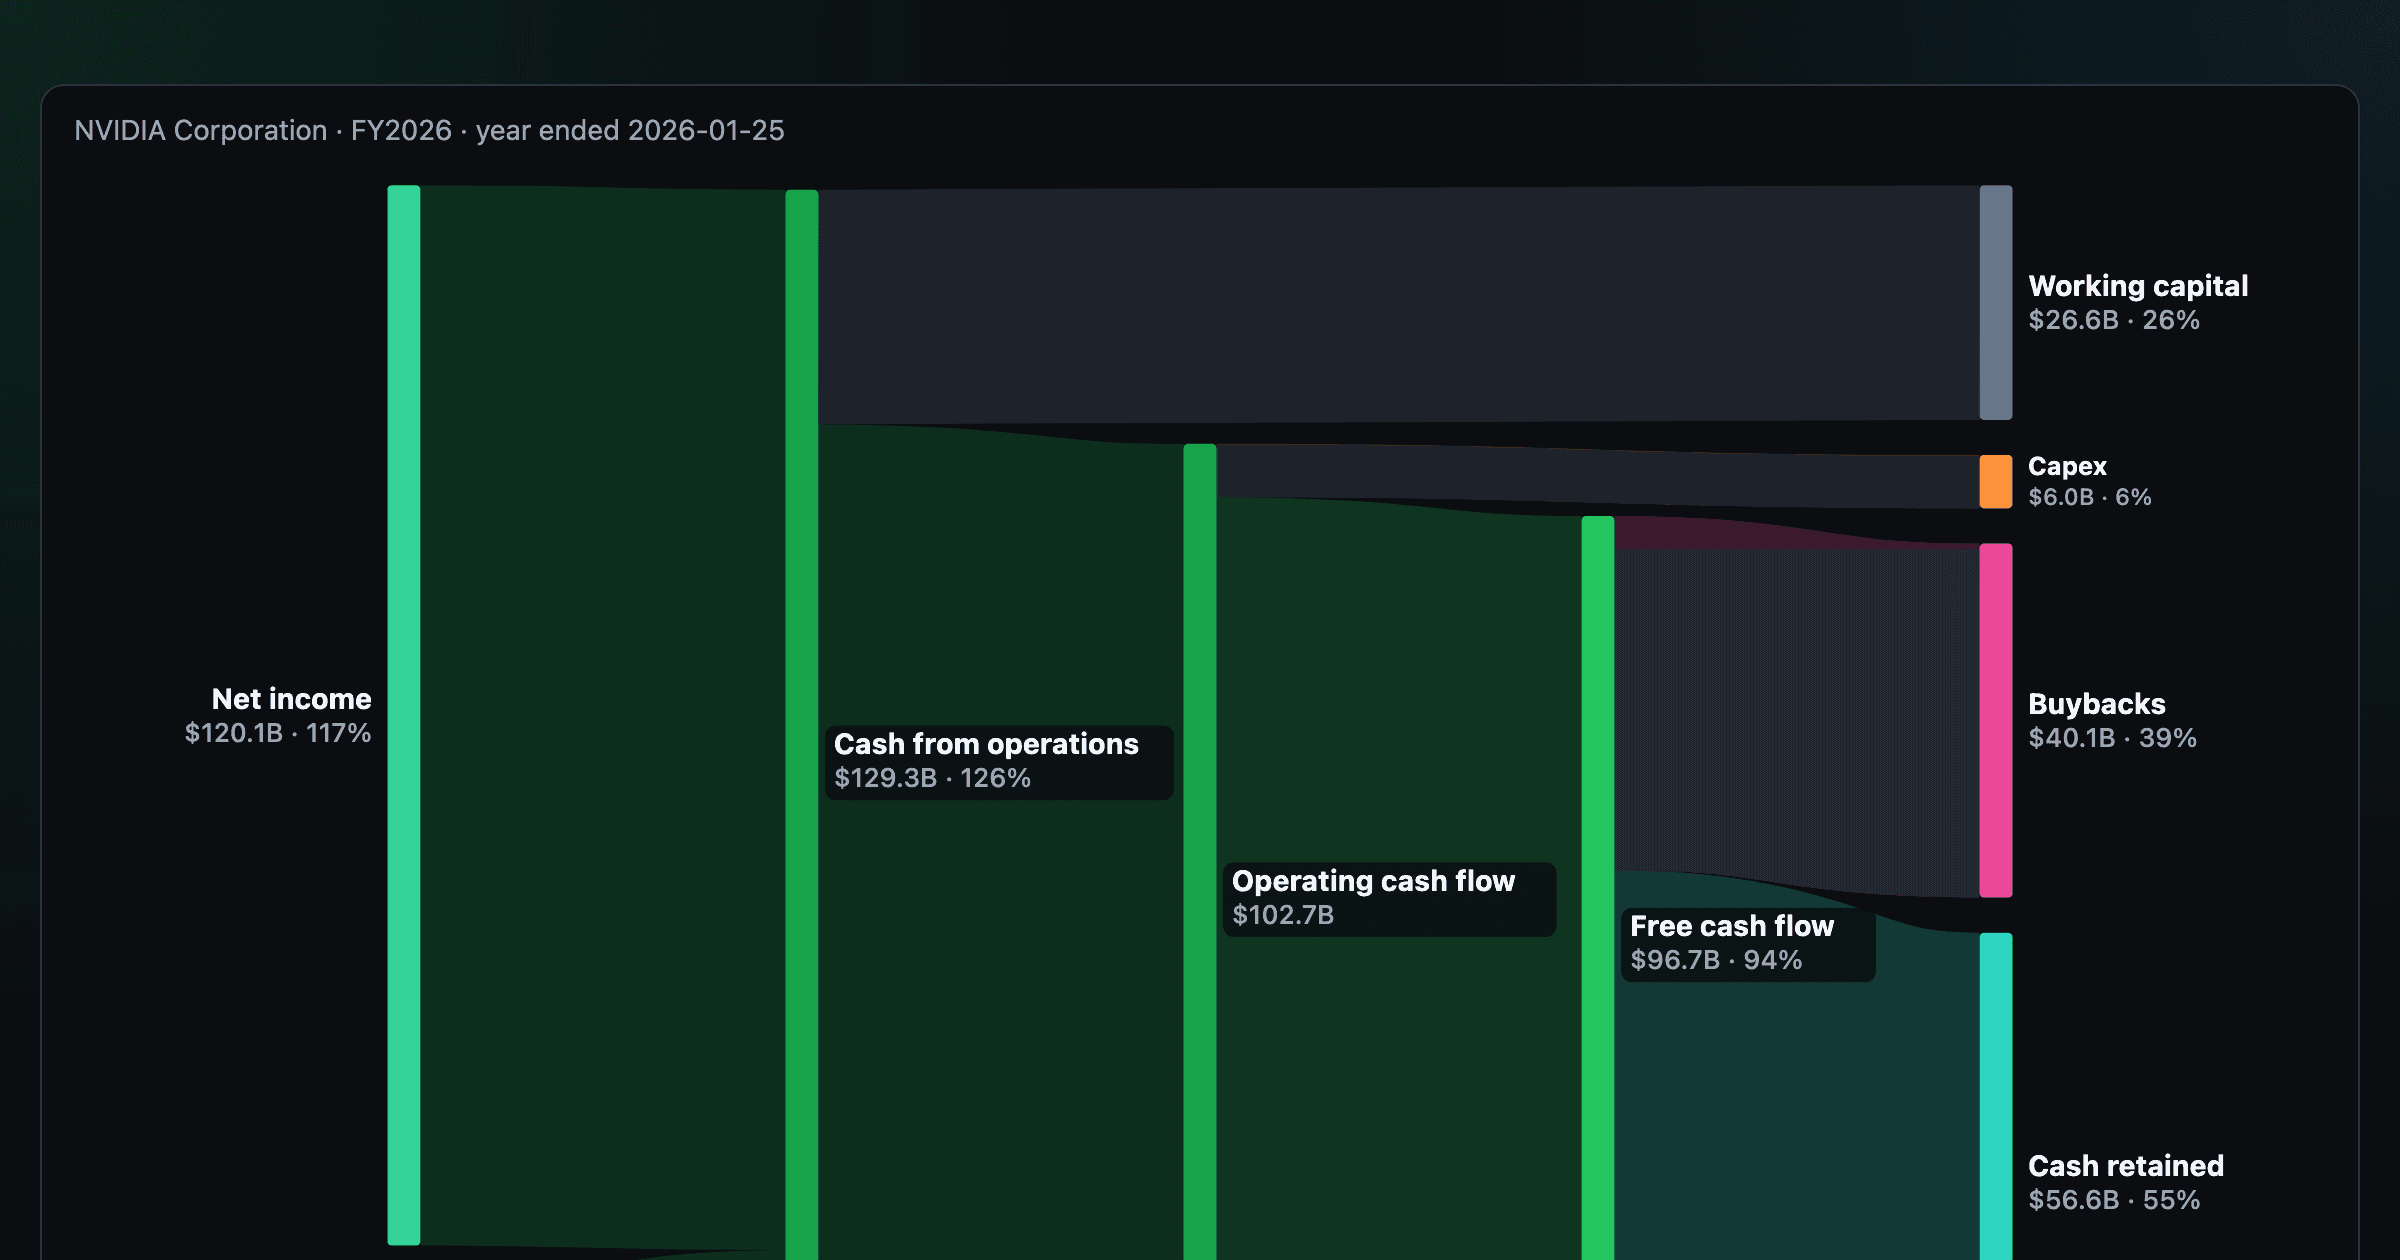
Follow a company's cash from net income through operating cash flow into capex, buybacks, and dividends.
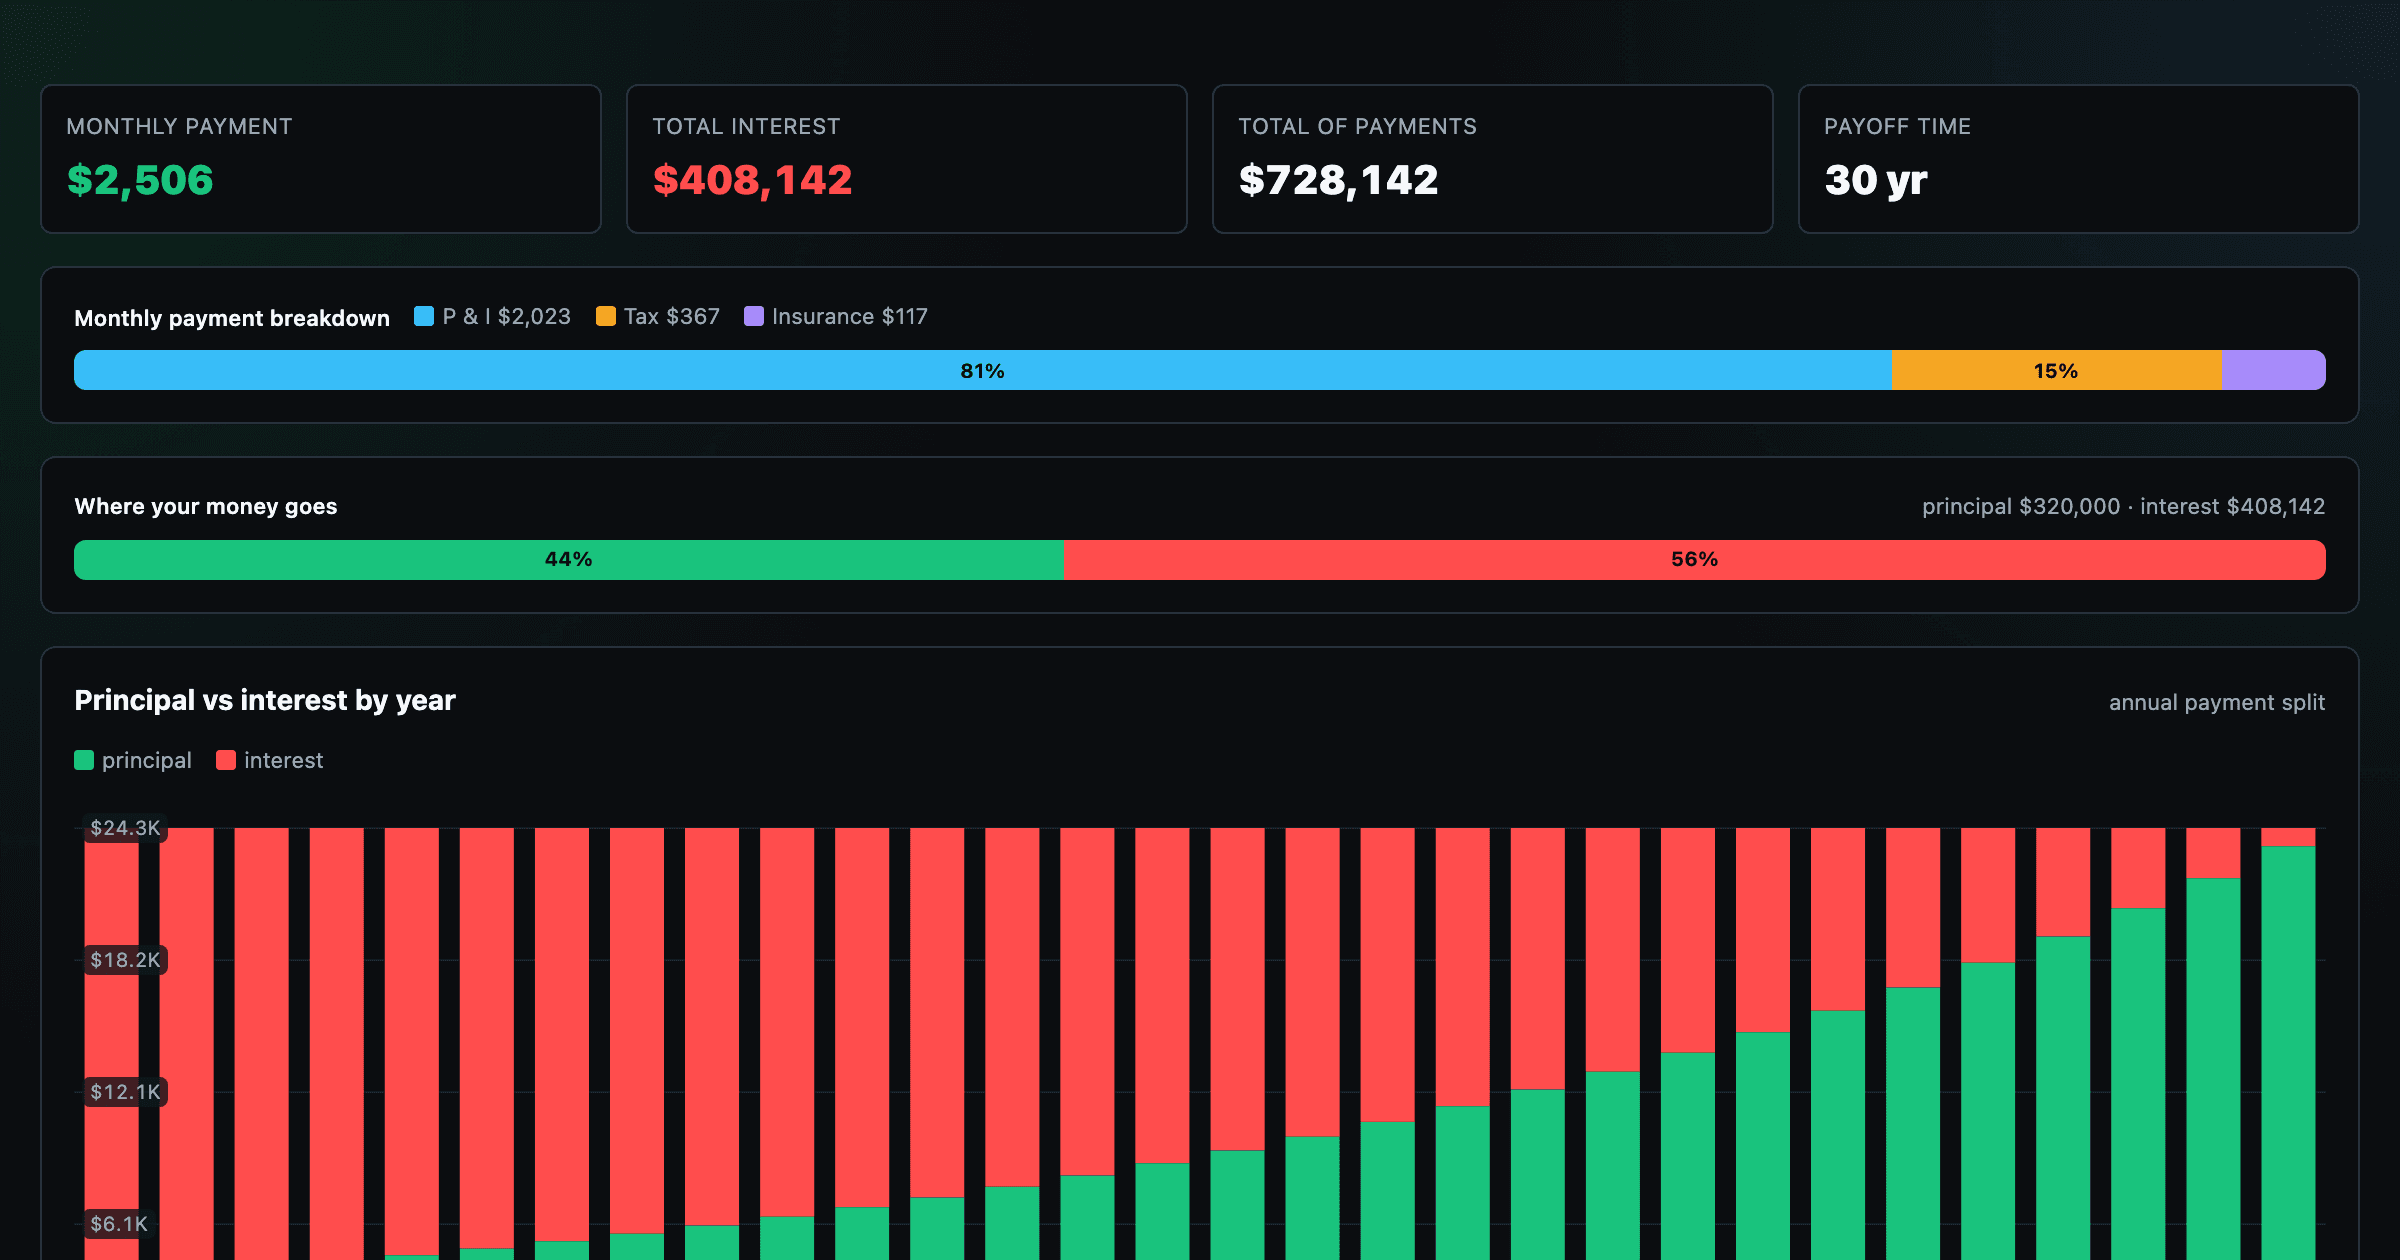
Monthly payment, principal vs interest by year, and the balance paydown — with extra-payment savings.
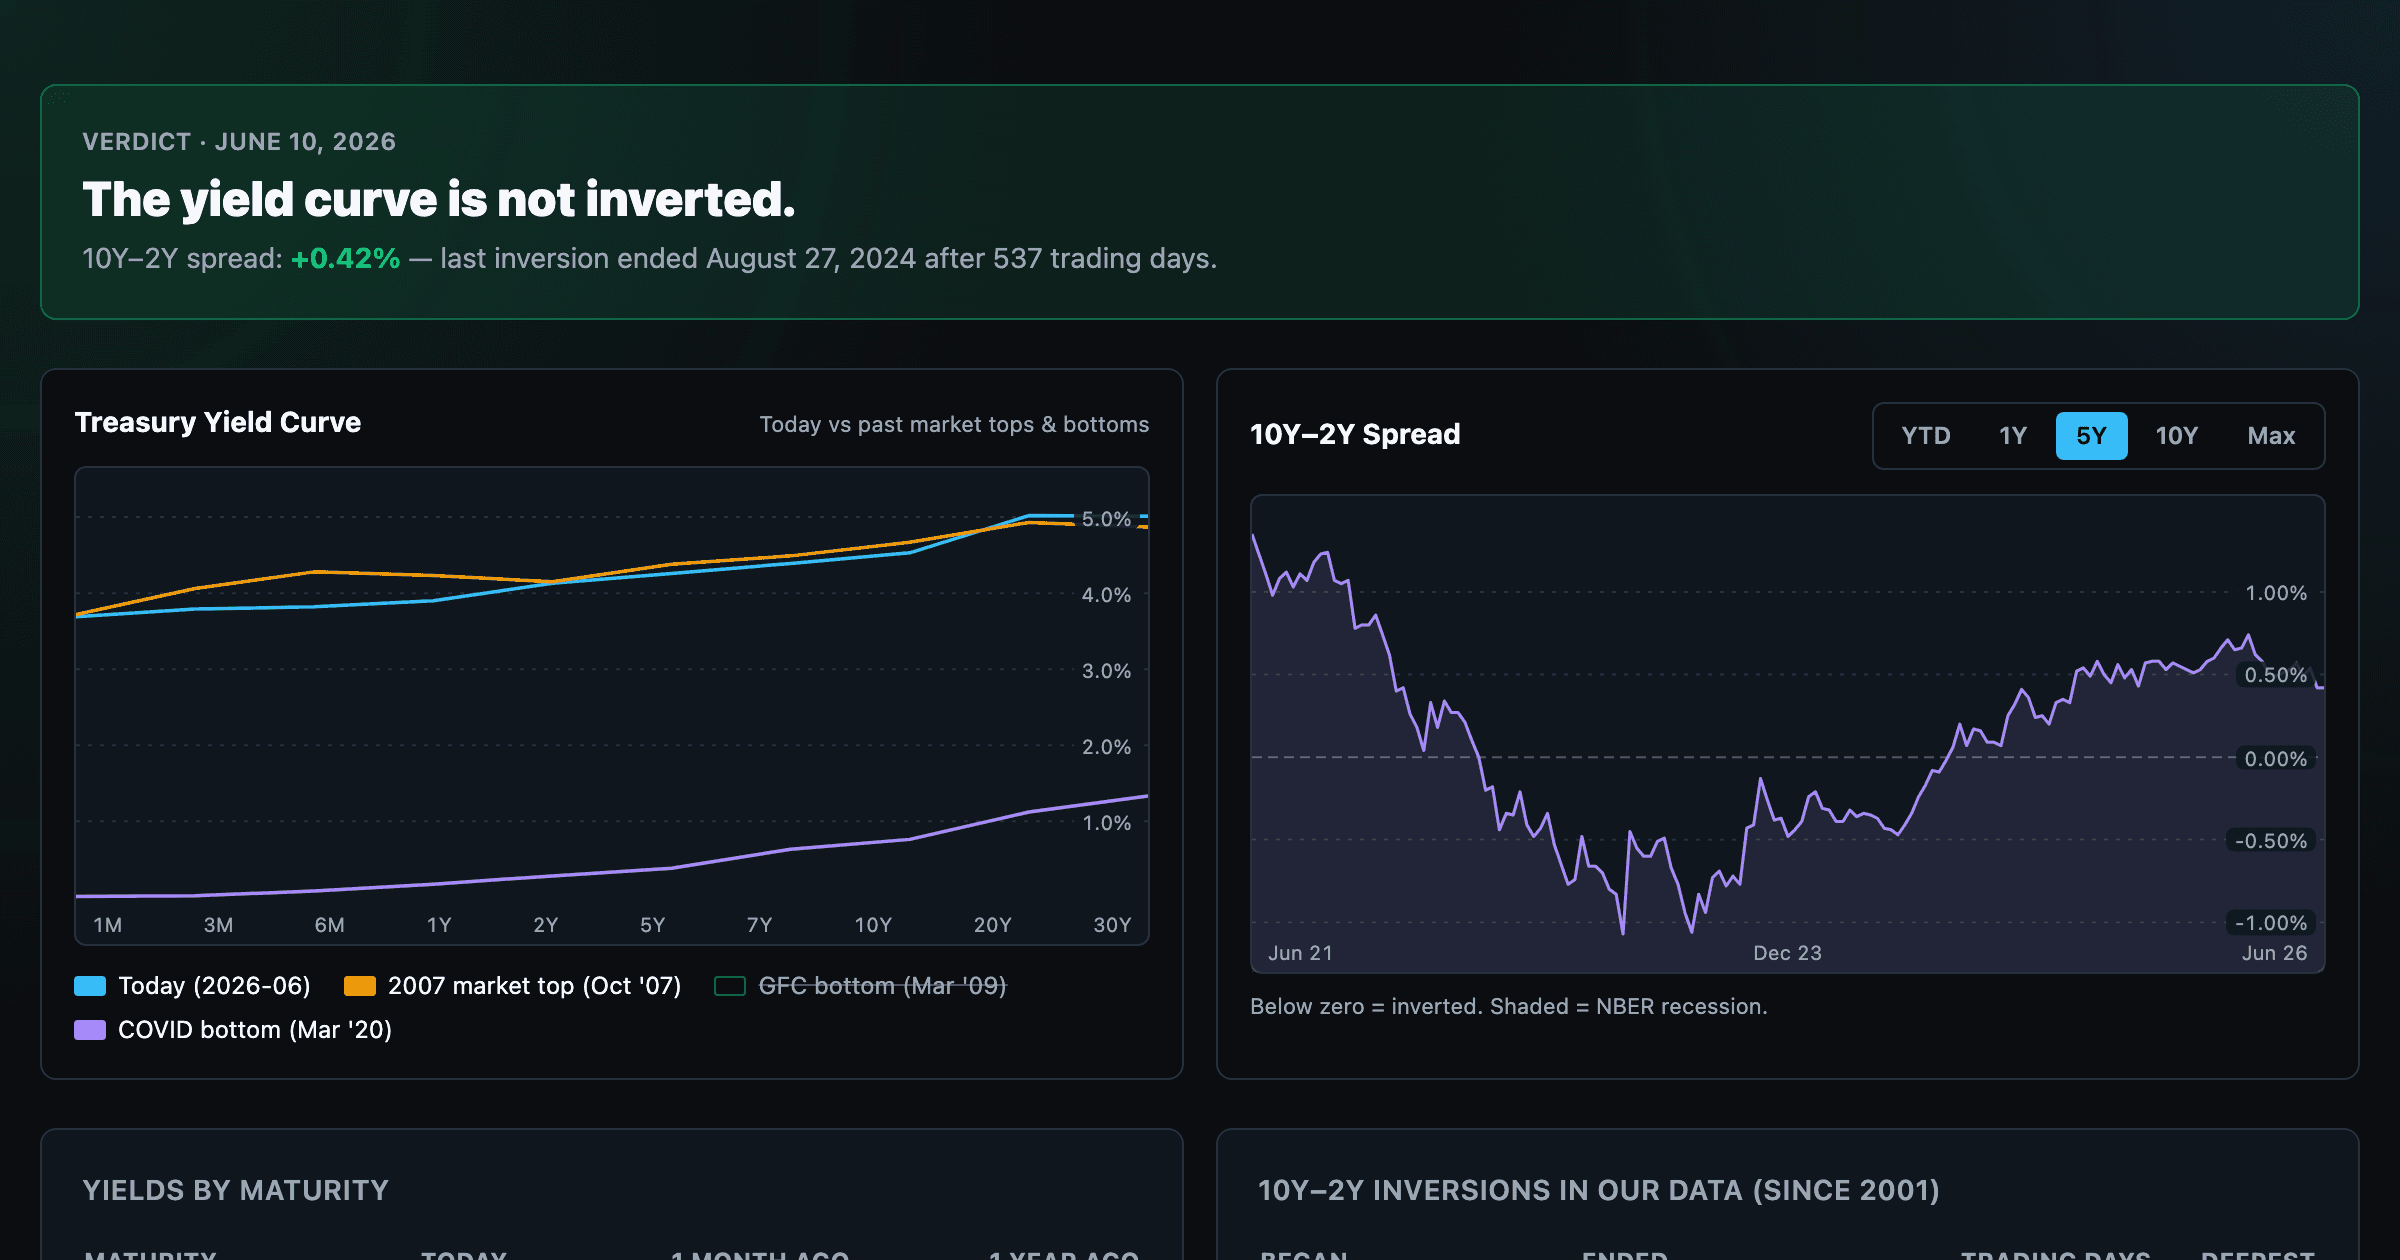
Live term structure, the 10Y–2Y spread, and every inversion episode.