
A $400,000 home with 20% down, at 6.5% for 30 years
with 1.1% property tax, 0.35% home insurance, and $0.00 extra toward principal each month.
A $320,000 mortgage at 6.5% over 30 years is $2,023/mo in principal & interest — $2,506/mo with property tax and insurance — and $408,142 in total interest over 30 yr. Change any figure above to see your monthly payment, principal-vs-interest split, balance paydown, and how extra payments shorten the loan.
Methodology#
Payments use the standard fixed-rate formula and assume a constant interest rate for the life of the loan. Property tax and homeowners insurance are estimated as an annual percentage of the home's value (US averages: ~1.1% tax, ~0.35% insurance) and added to the monthly payment as escrow — they don't affect the loan amortization. PMI and HOA dues are not included and vary by lender and location. "Extra / month" is applied to principal each month, which shortens the term and cuts total interest; the schedule is aggregated by year. Figures are estimates for planning, not a loan offer or financial advice.
FAQ
- How is a monthly mortgage payment calculated?
- It uses the standard fixed-rate amortization formula — a level monthly principal-and-interest payment over the full term. For example, a $320,000 loan at 6.5% over 30 years works out to $2,023/month in principal and interest.
- What's included in the monthly payment?
- Principal and interest on the loan, plus optional escrow for property tax and homeowners insurance (estimated as a percentage of the home's value). PMI and HOA dues are not included — they vary by lender and location.
- How do extra payments save money?
- Any amount you add toward principal each month is applied directly to the loan balance, which shortens the term and cuts total interest. Set an extra-payment amount above to see exactly how many months and how much interest you'd save.
More visualizations
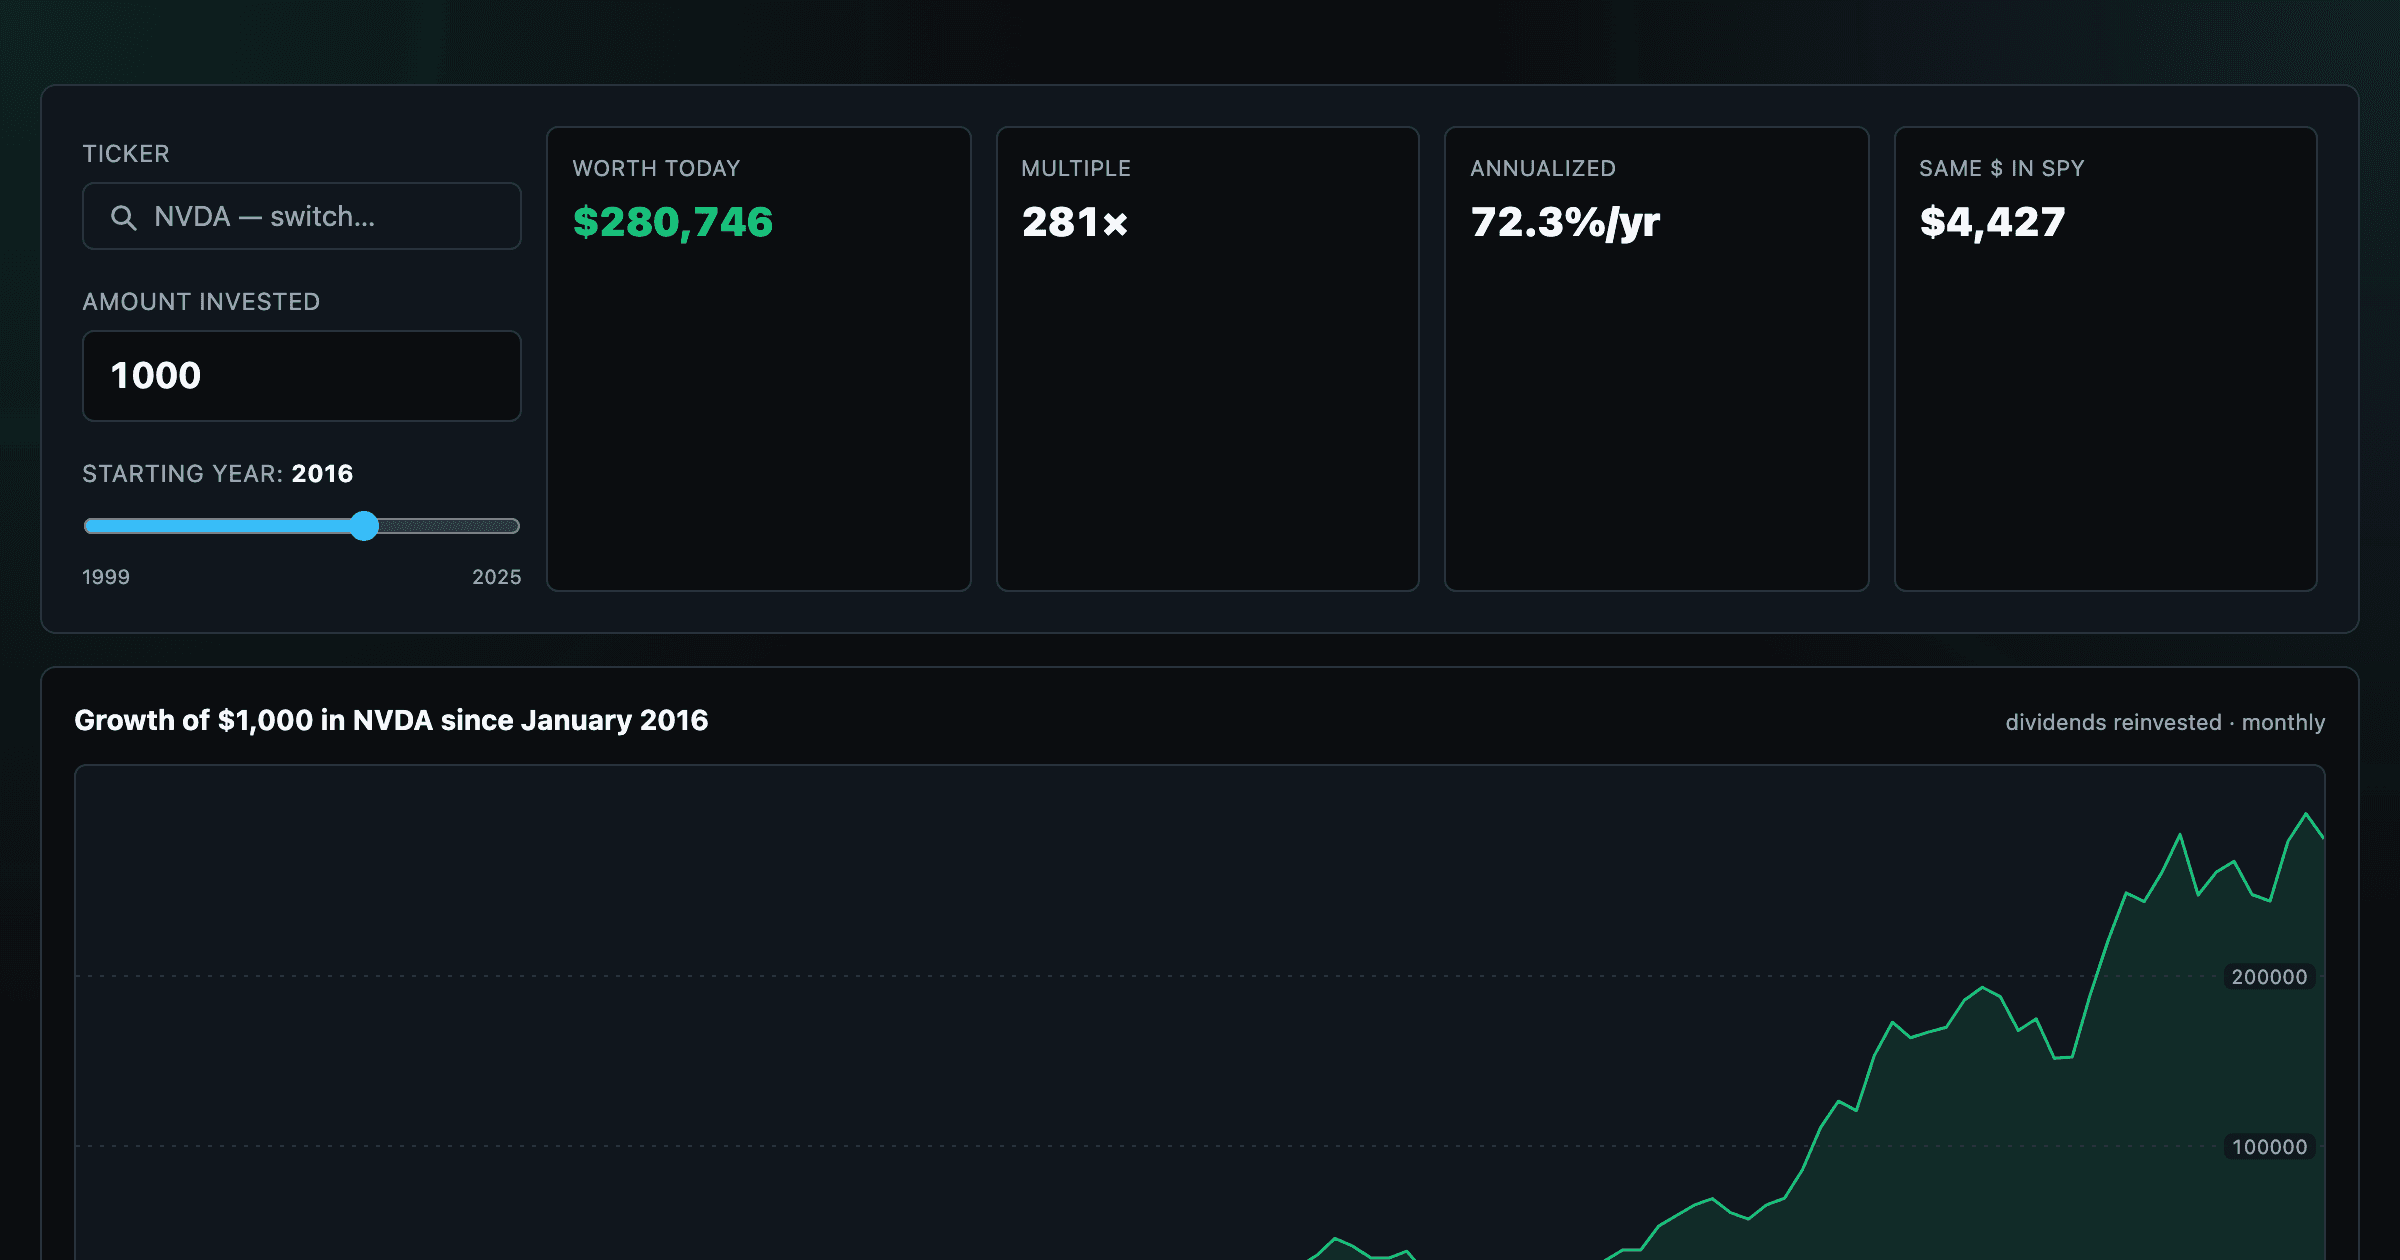
What $1,000 in any stock or ETF would be worth today.

Every S&P 500 company sized by market cap — color by return or valuation.
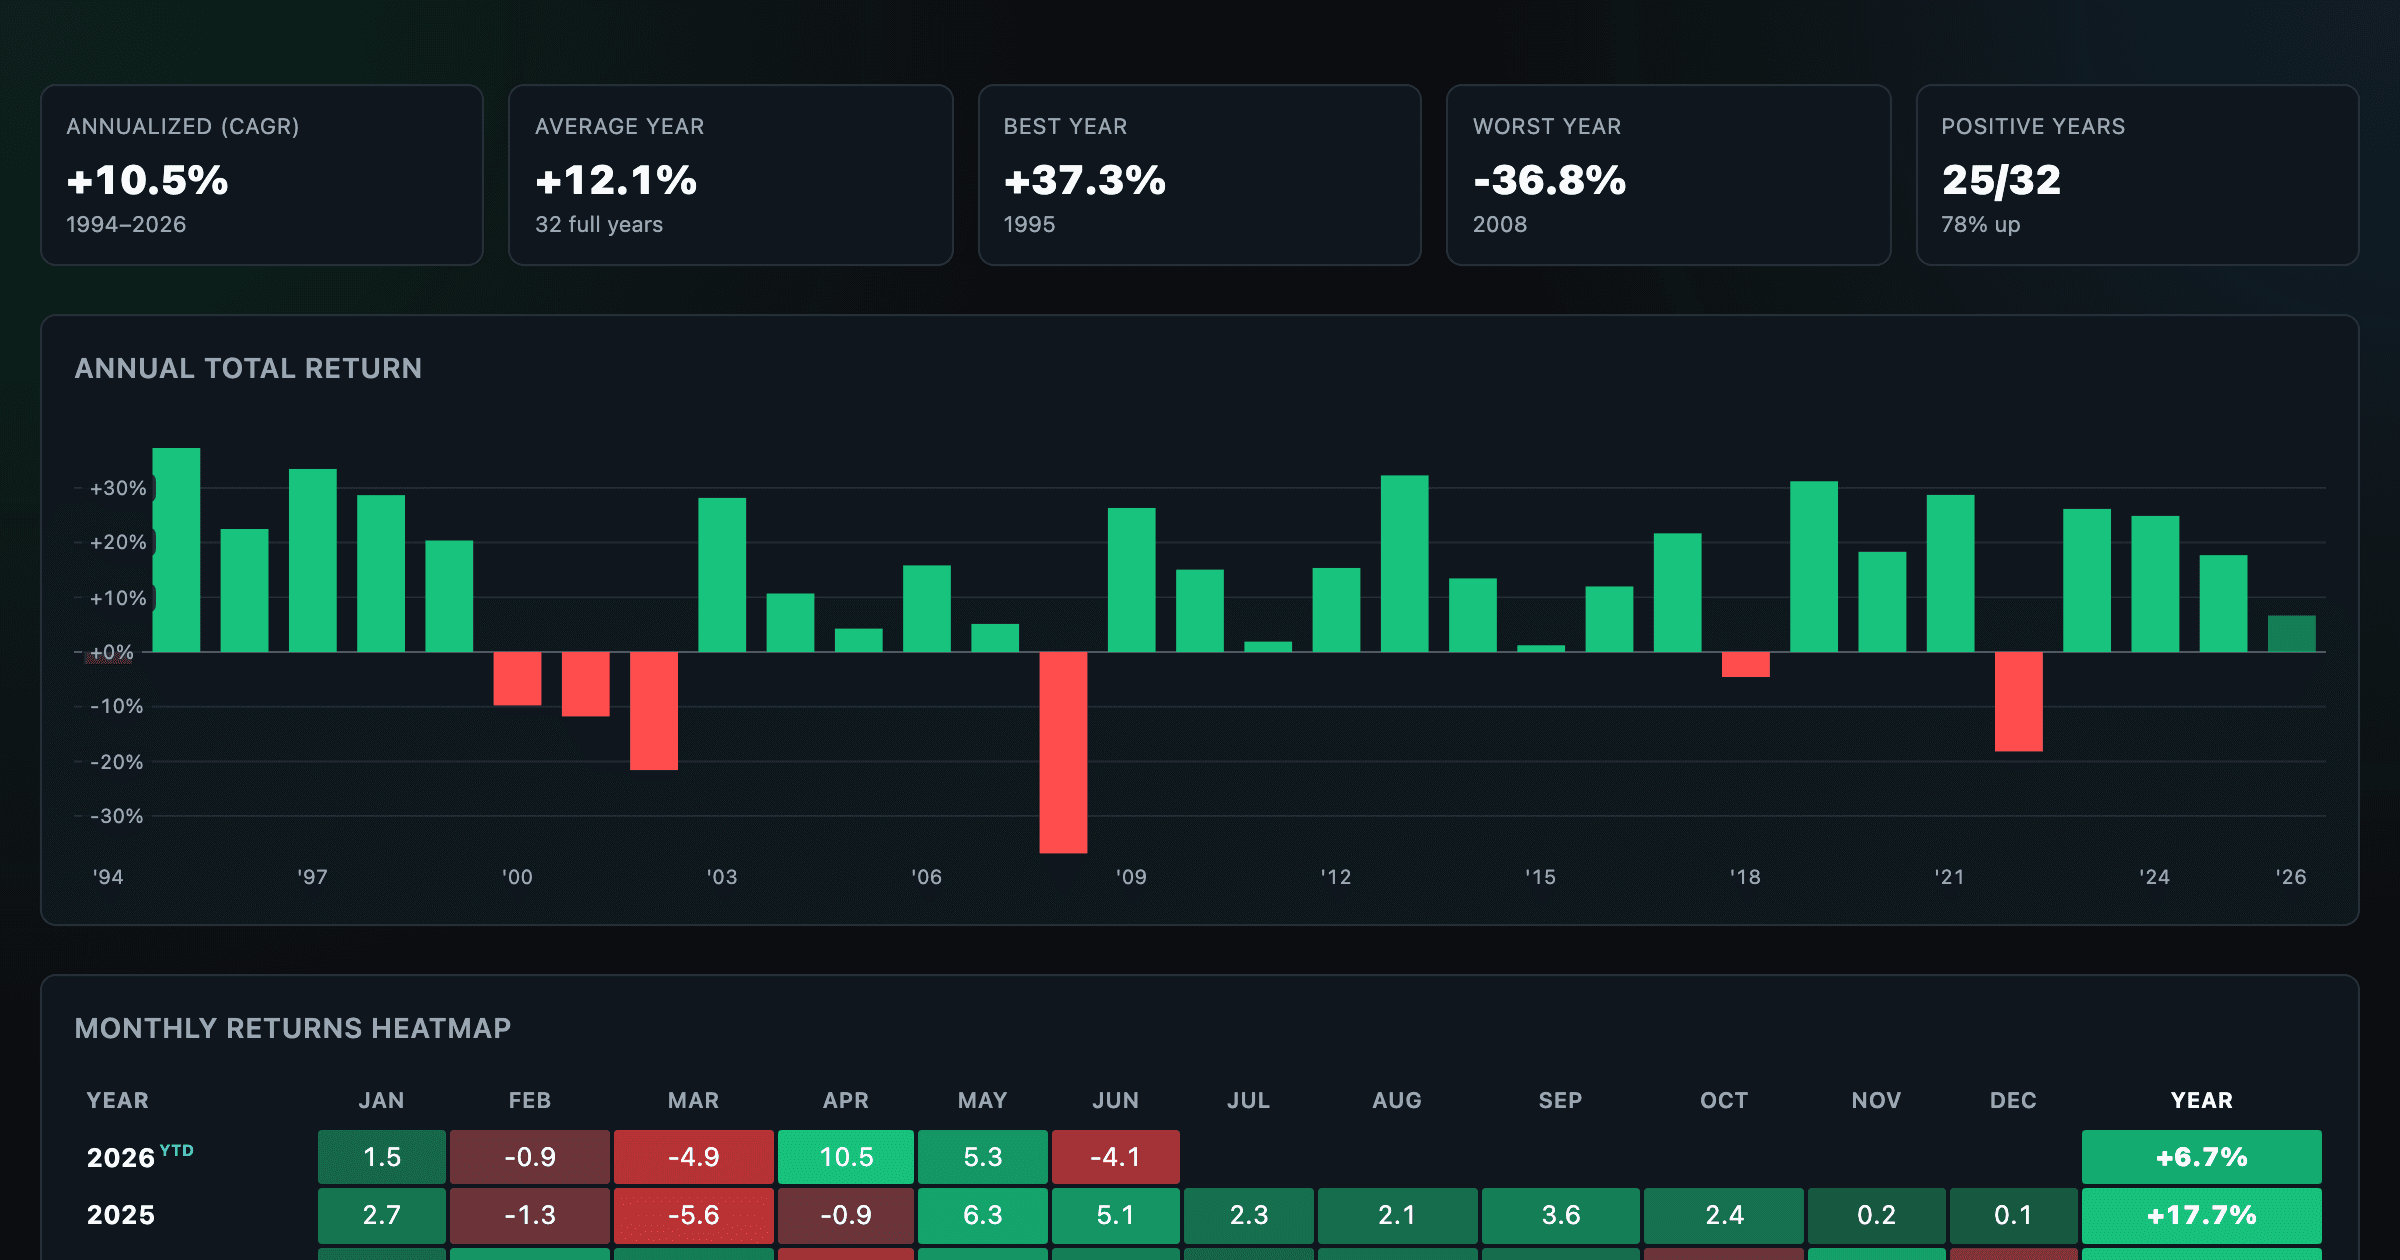
S&P 500 annual and monthly returns — every year, every month.
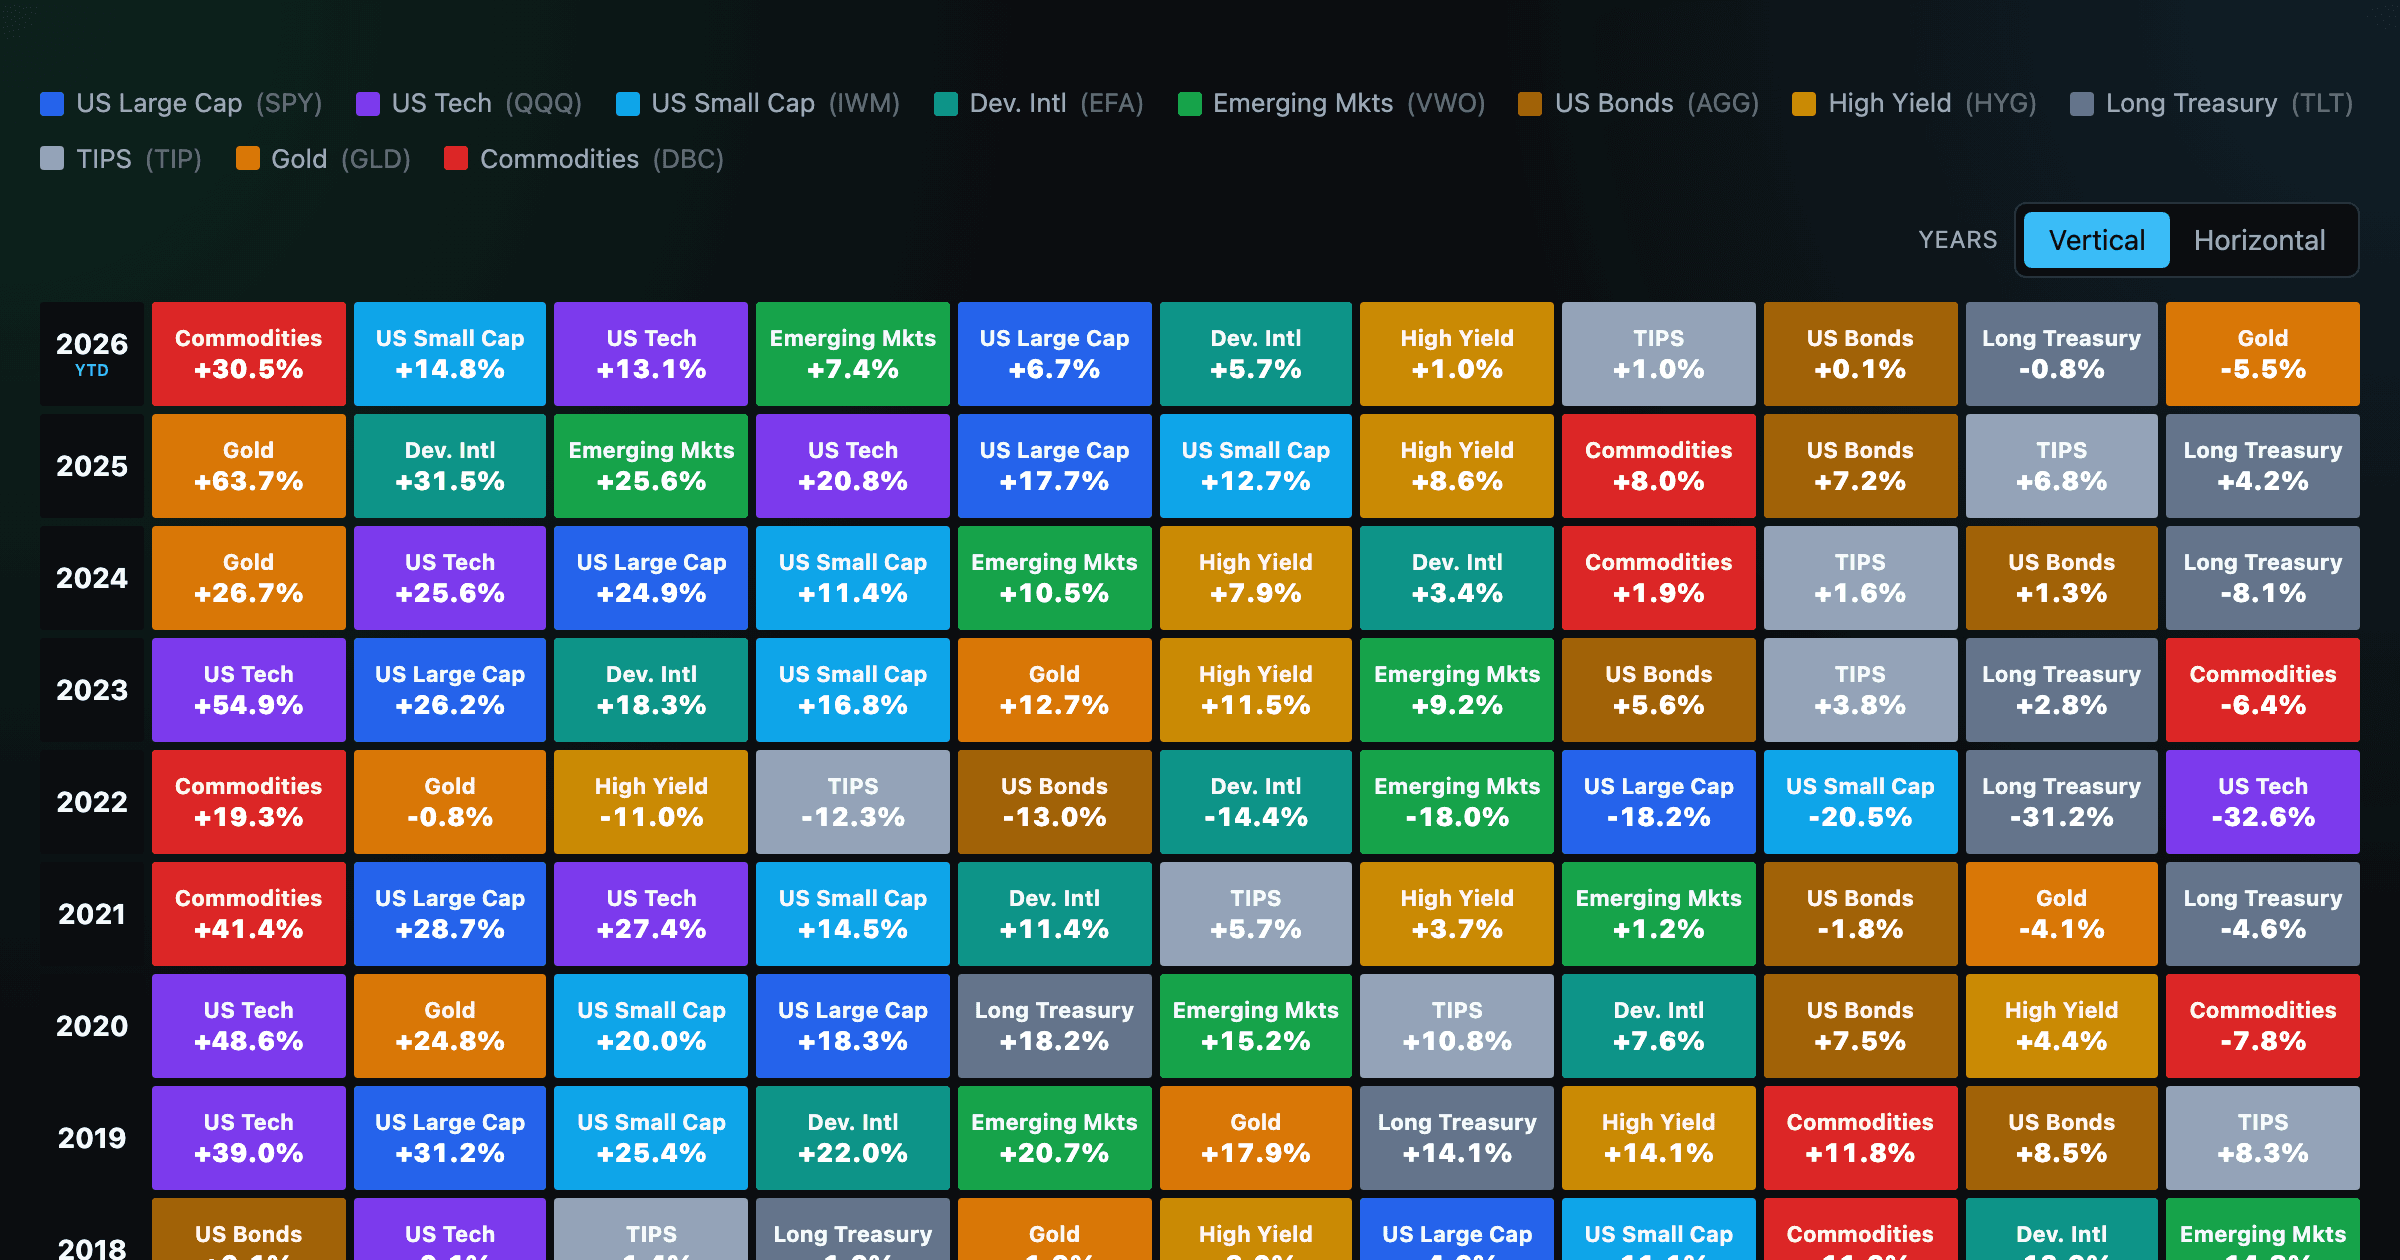
Asset-class returns ranked year by year — the Callan chart / asset allocation quilt.
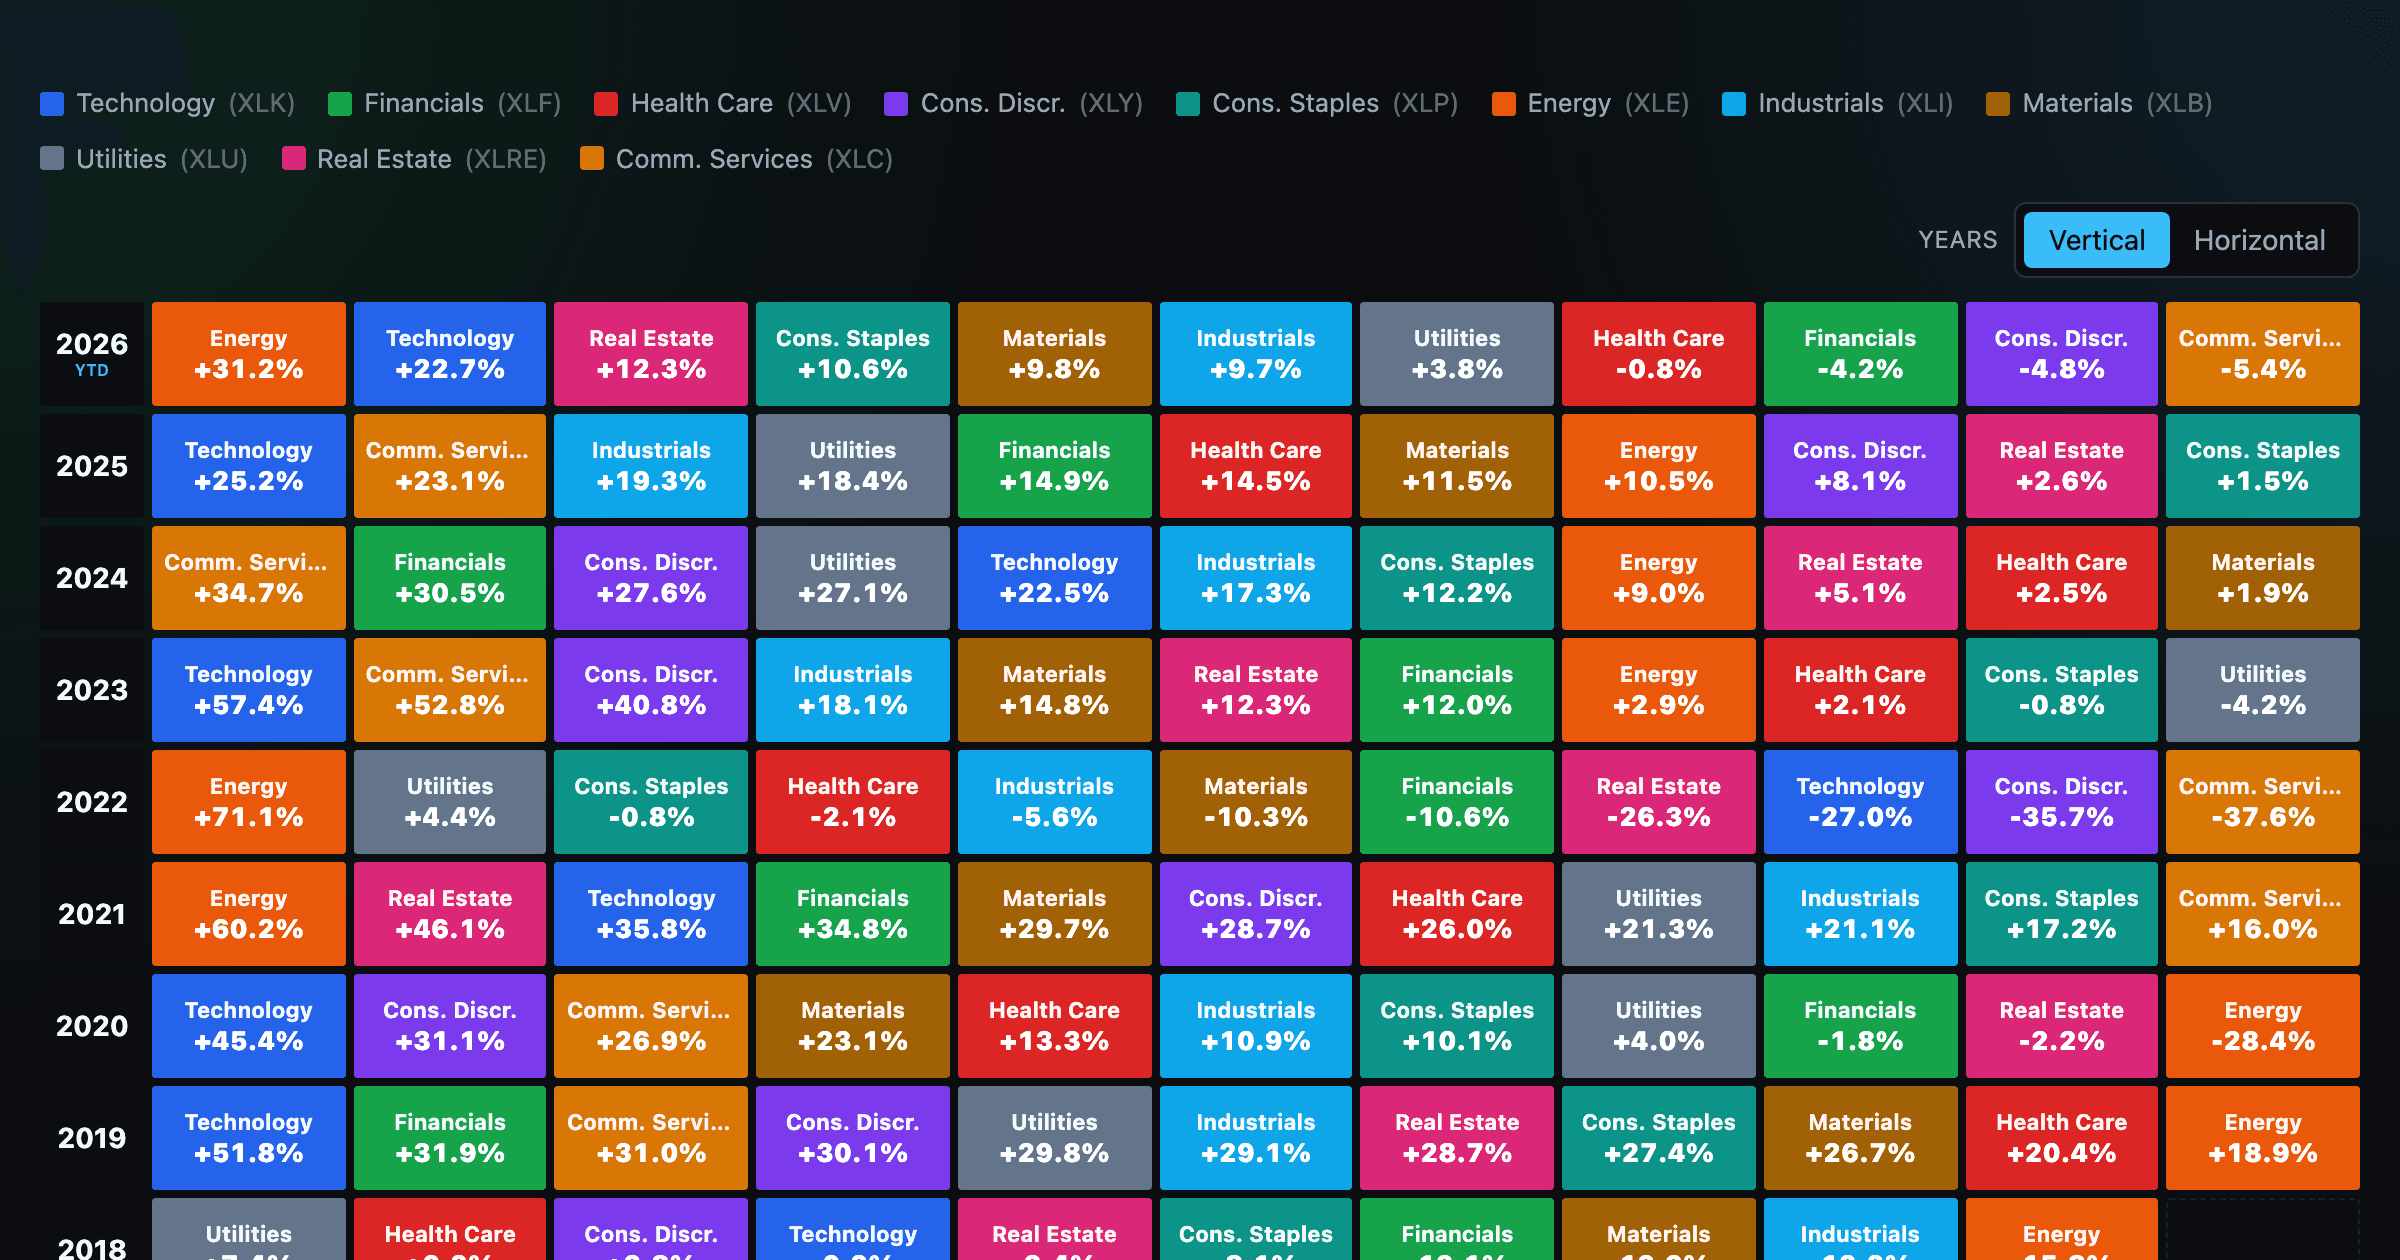
The 11 S&P 500 sectors ranked year by year — a sector quilt chart, back to 1999.
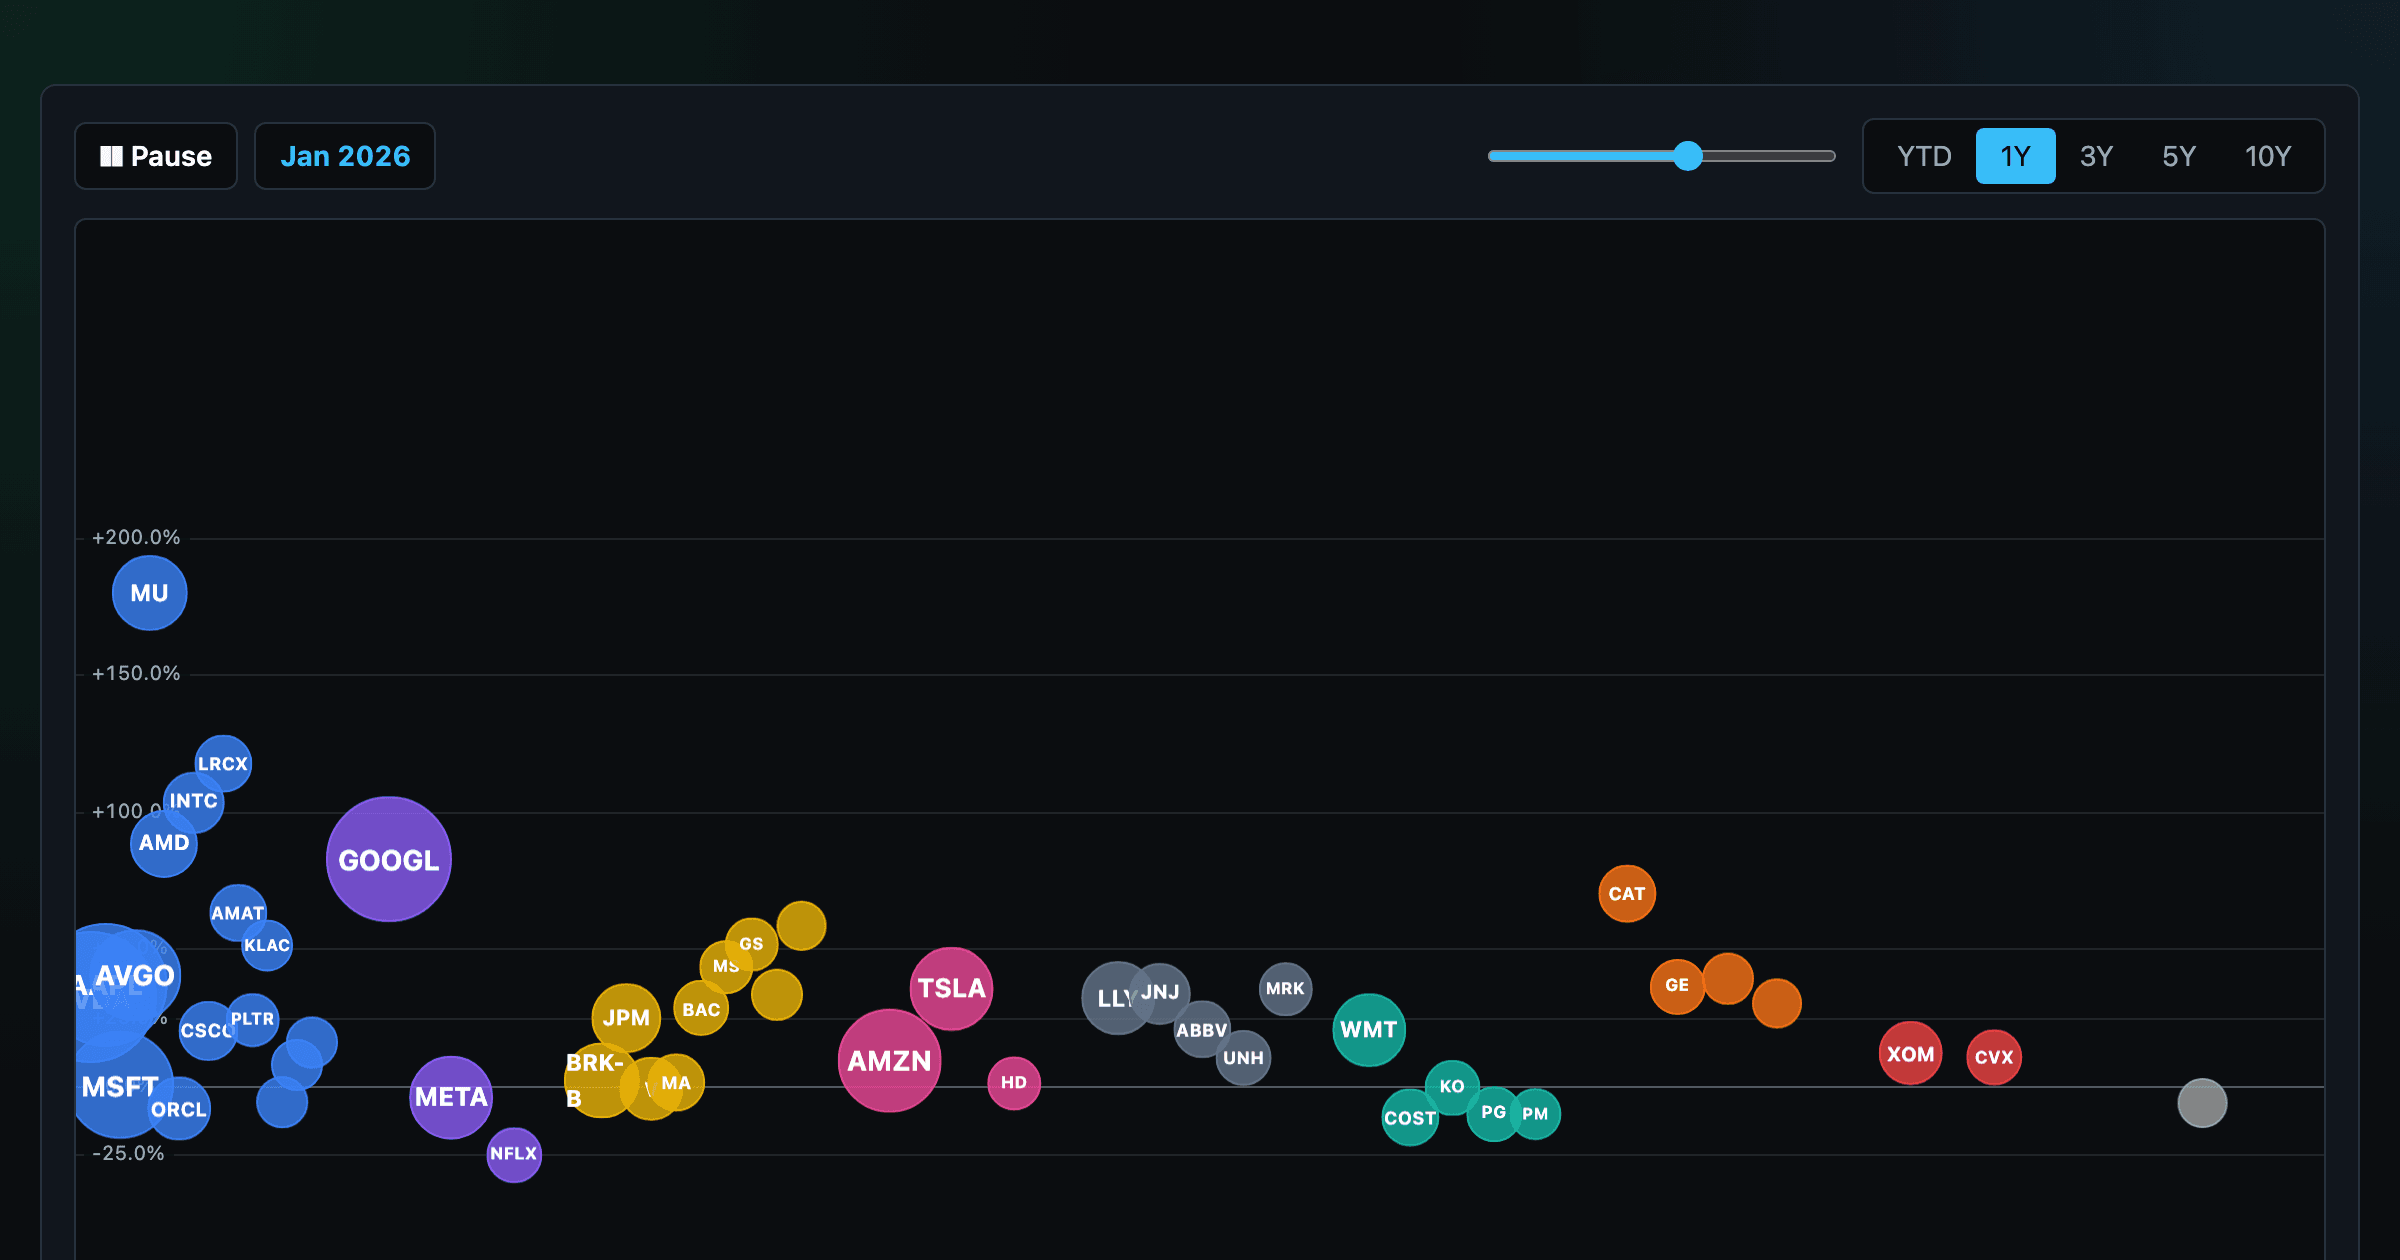
The biggest US companies as animated bubbles, rising and falling with their total return over time.
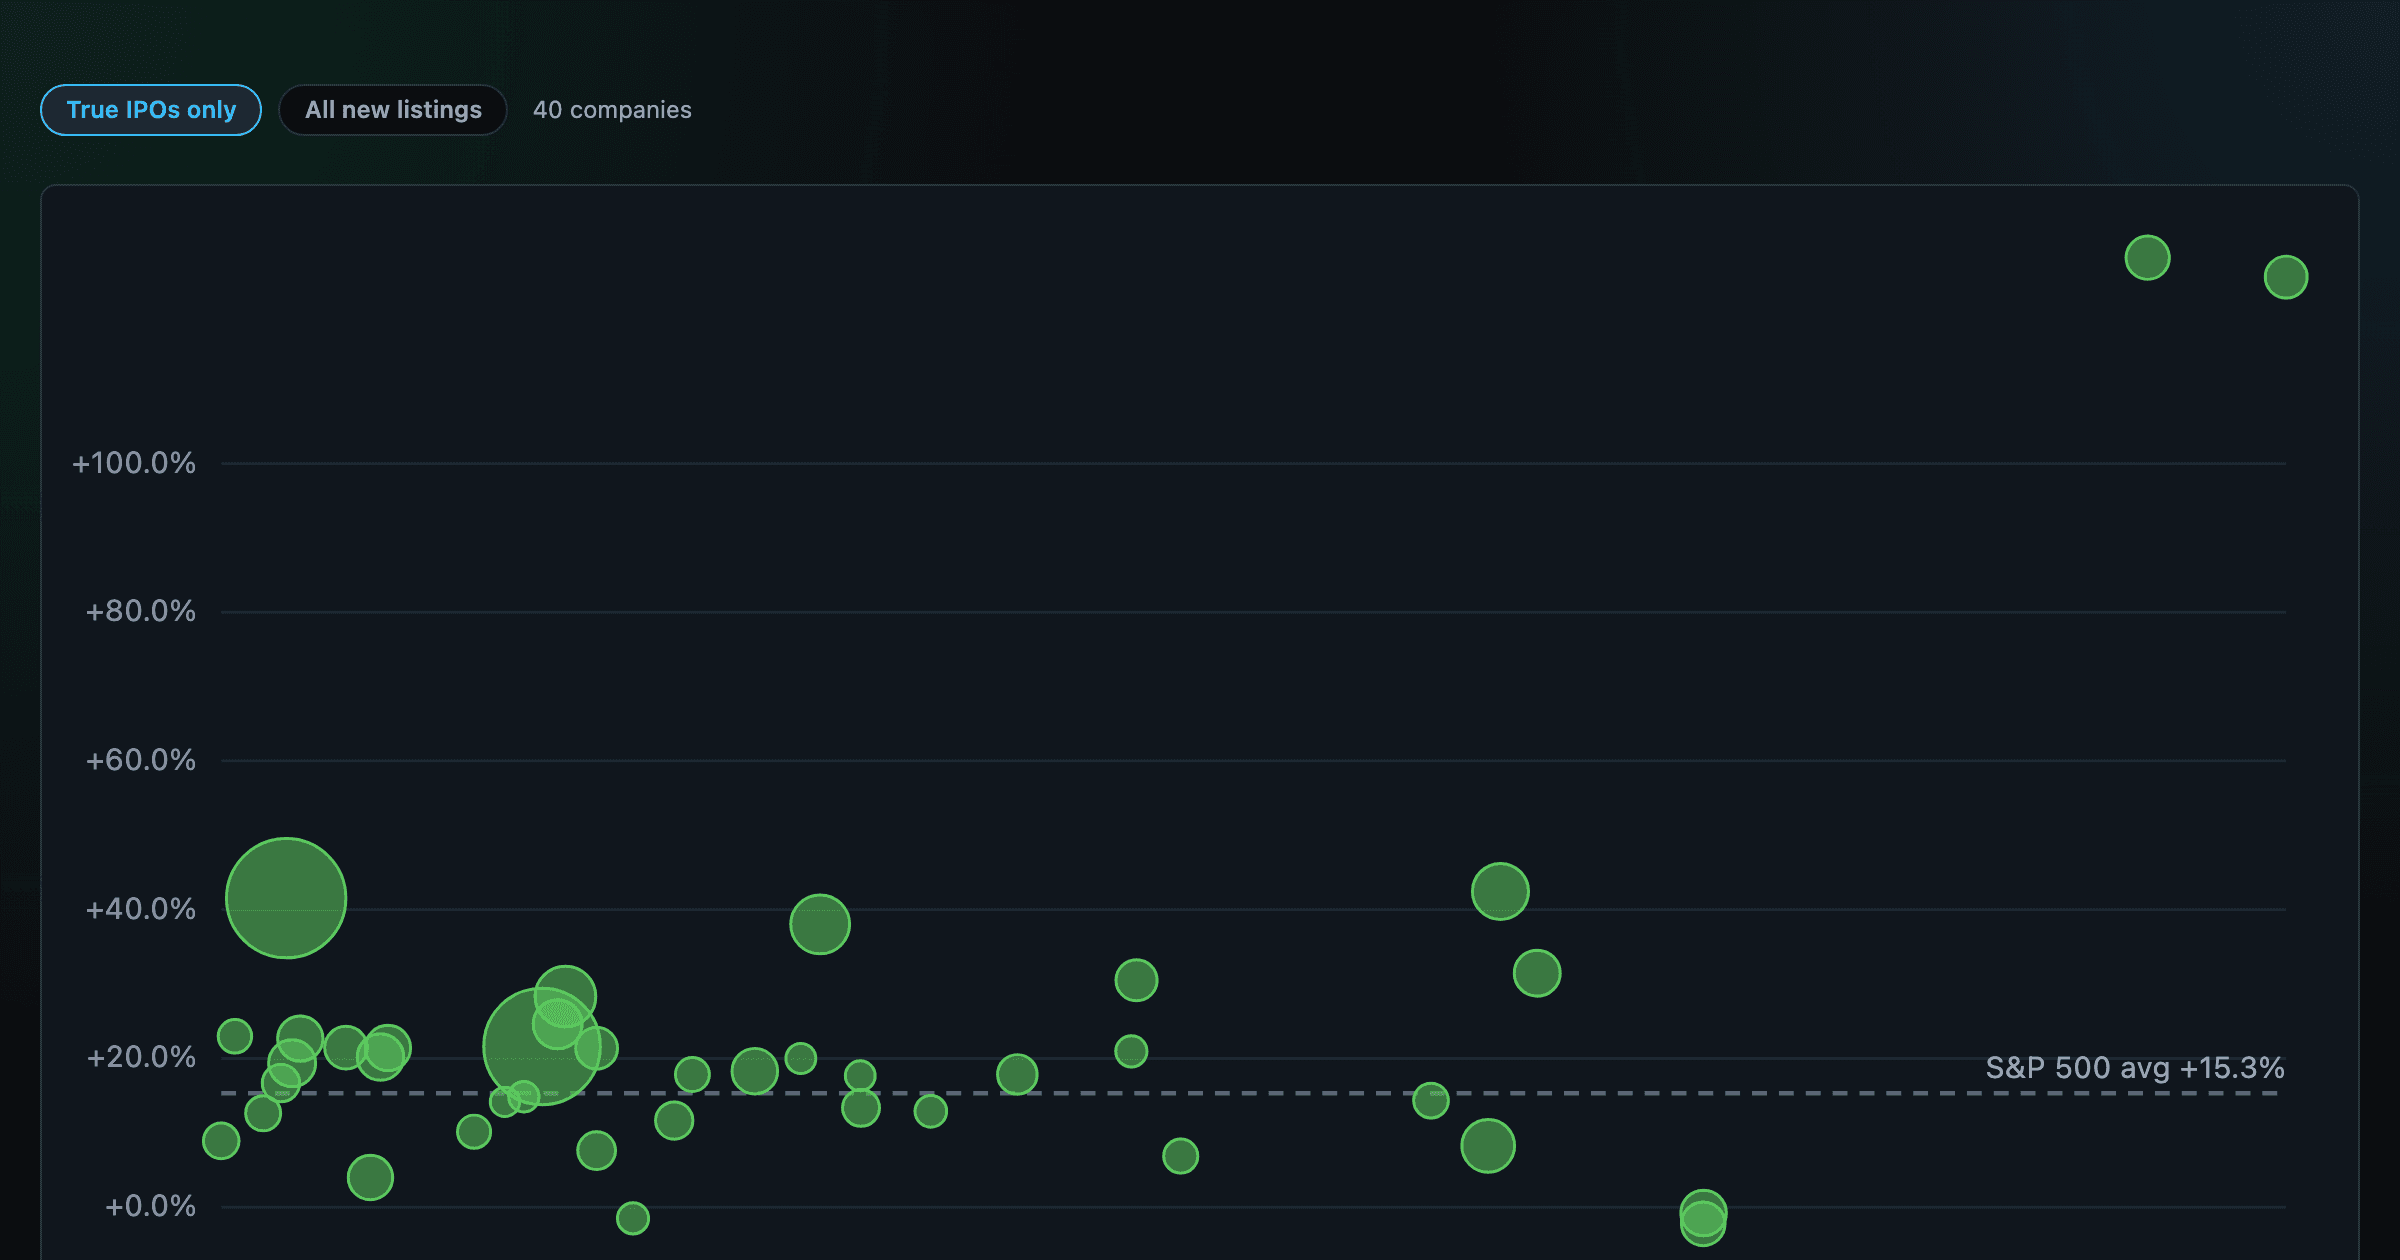
How recent stock-market debuts have performed since listing — annualized, vs the S&P 500, by IPO vs spin-off.
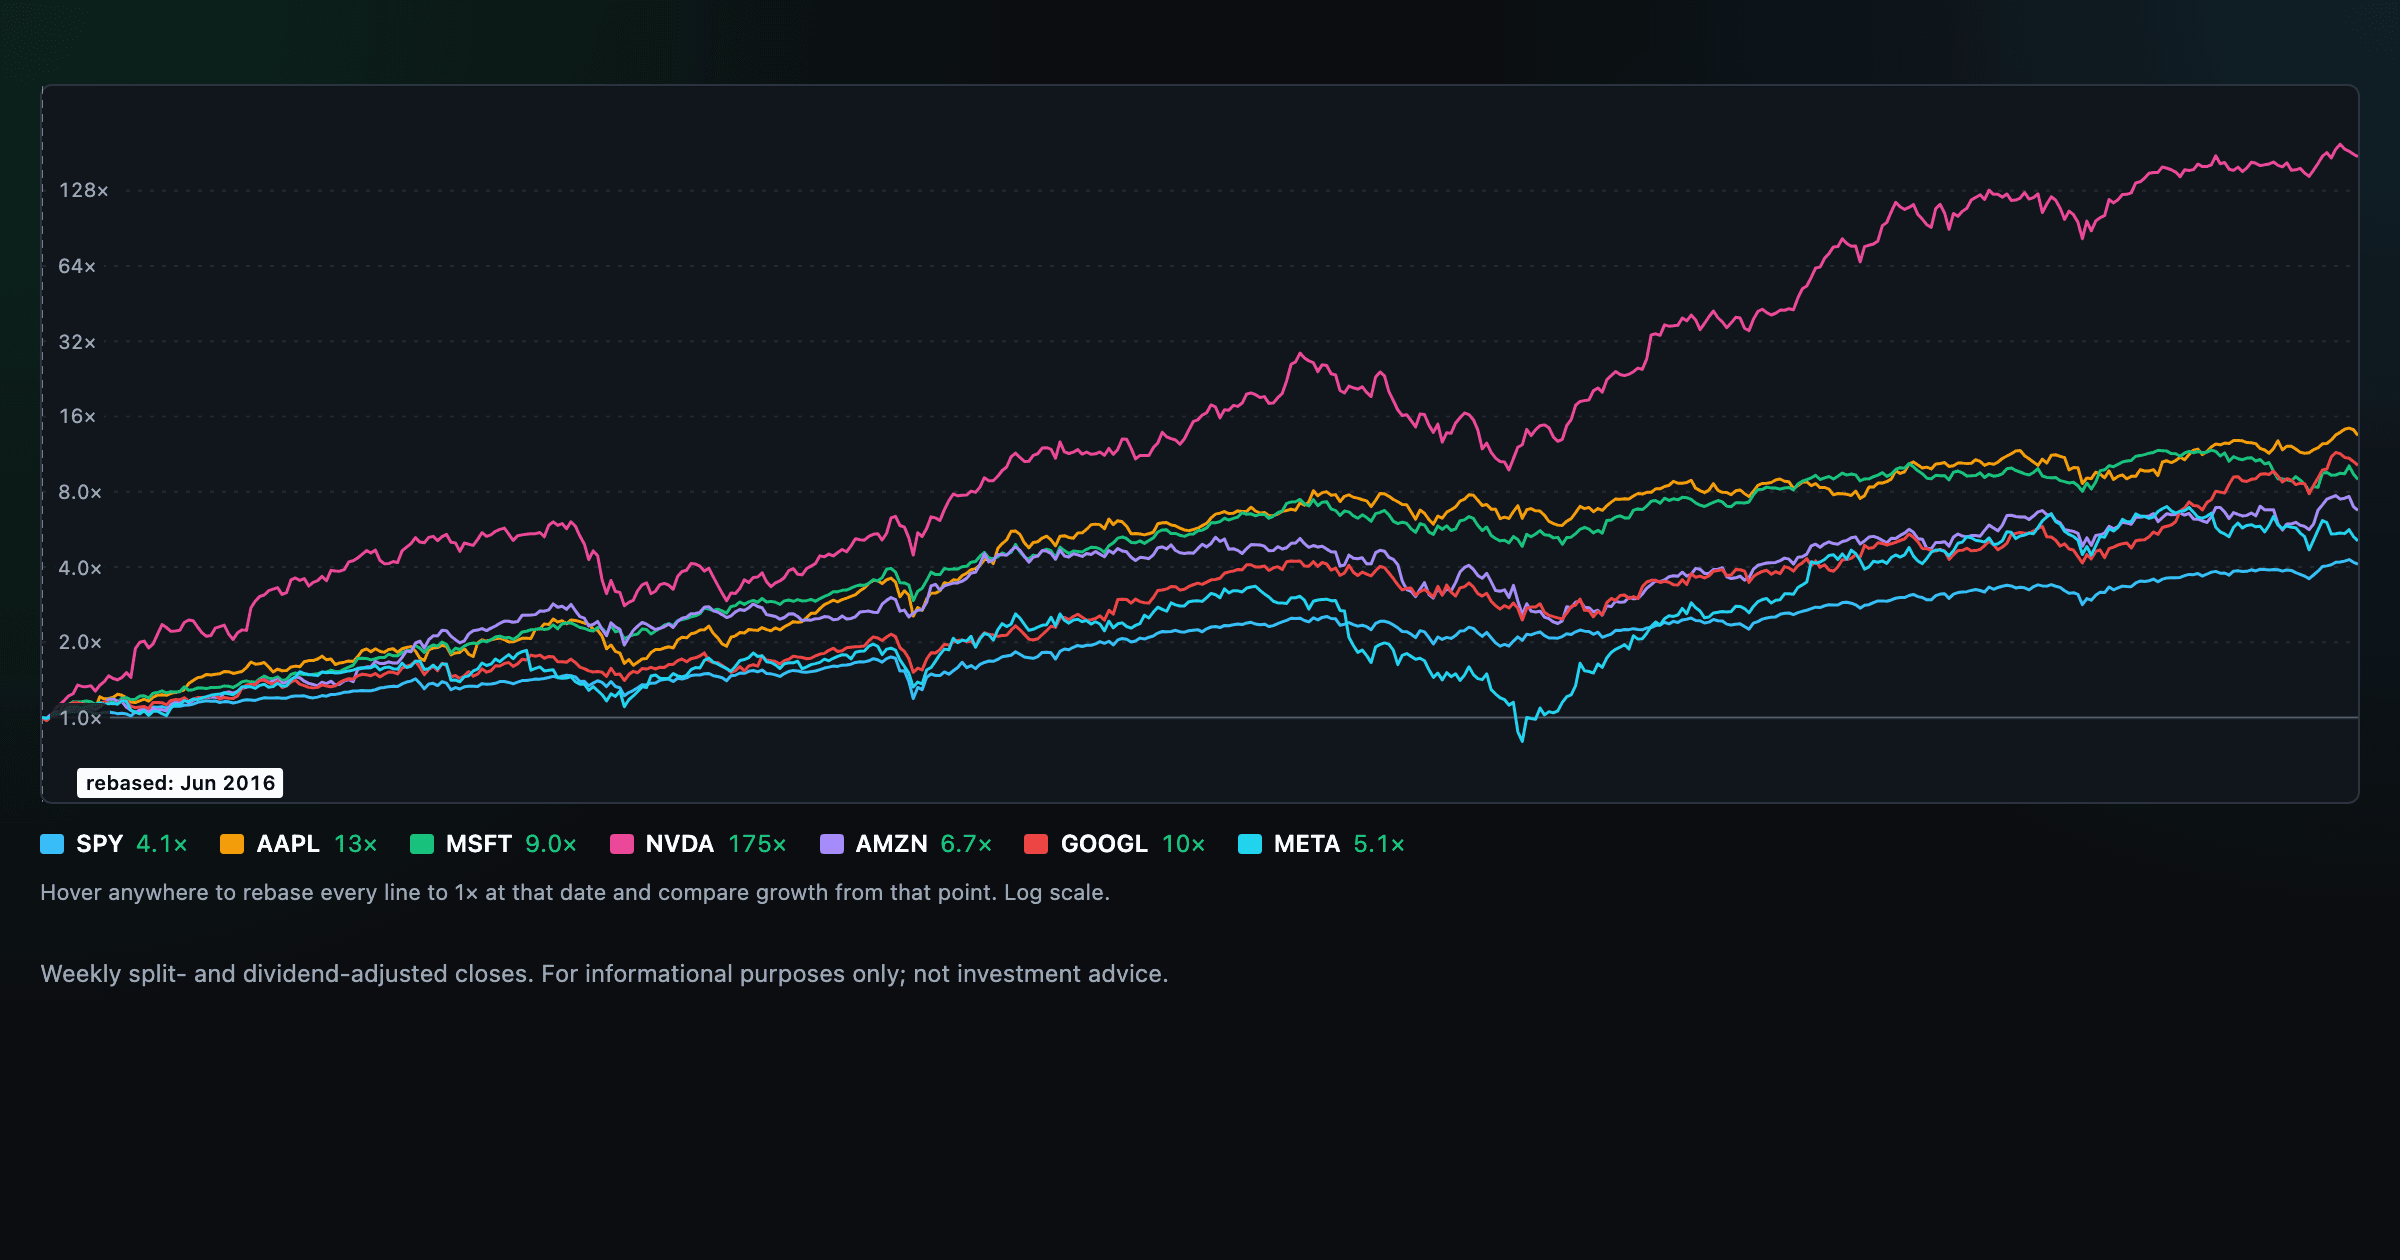
Compare megacaps vs the S&P 500, rebased to 1× at any date you hover.
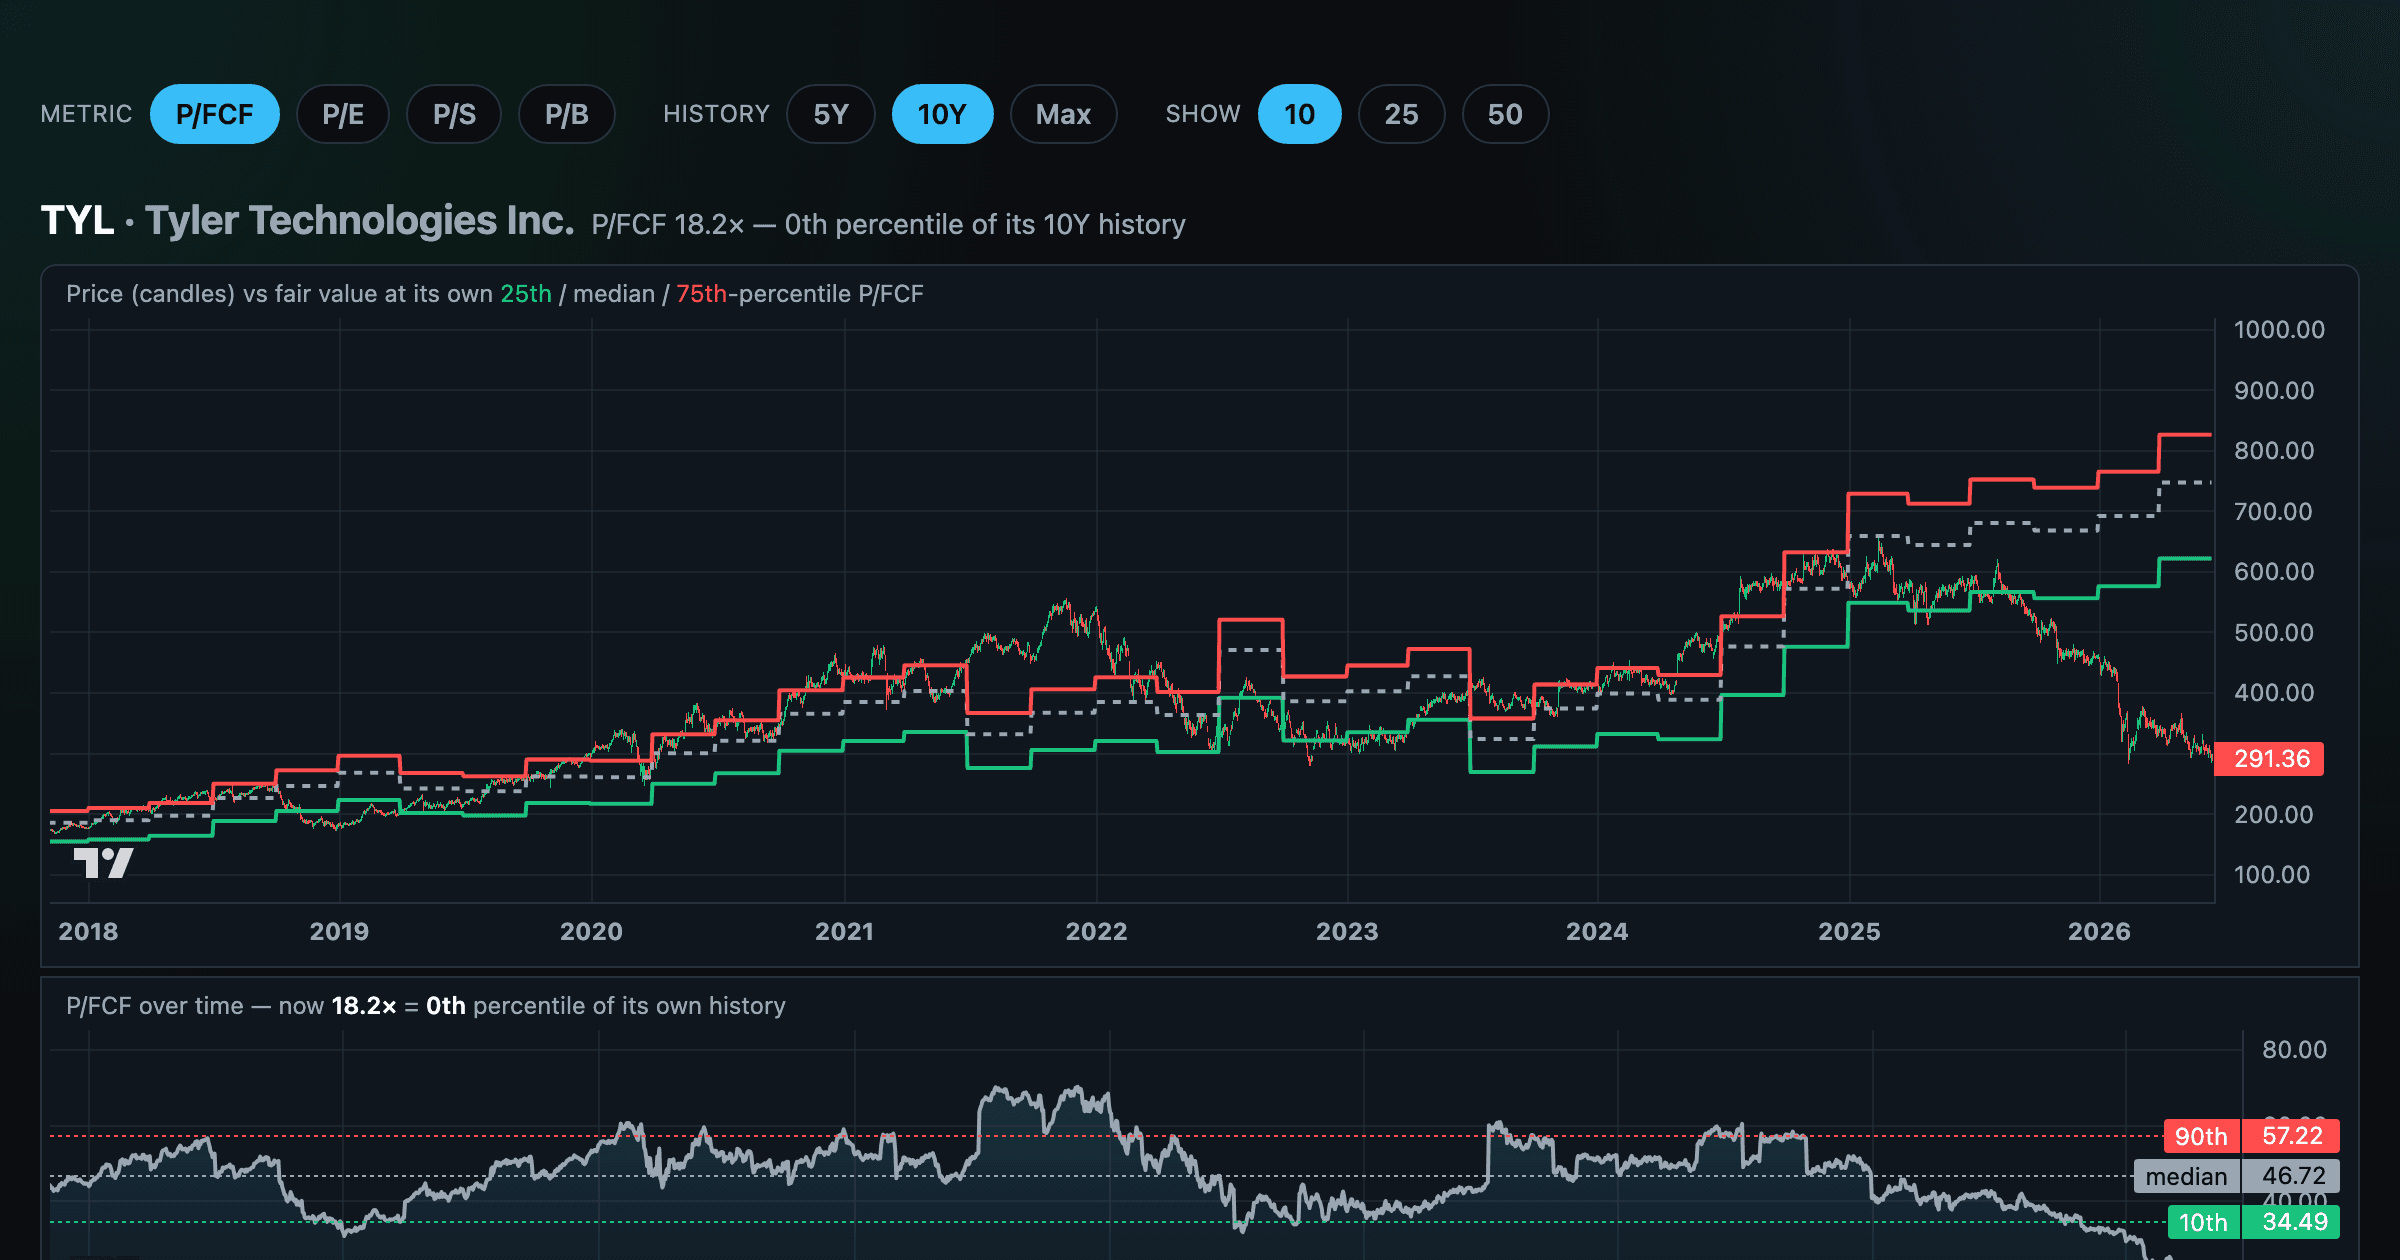
Stocks trading cheapest relative to their own P/E, P/FCF, P/S, or P/B history — with fair-value bands.
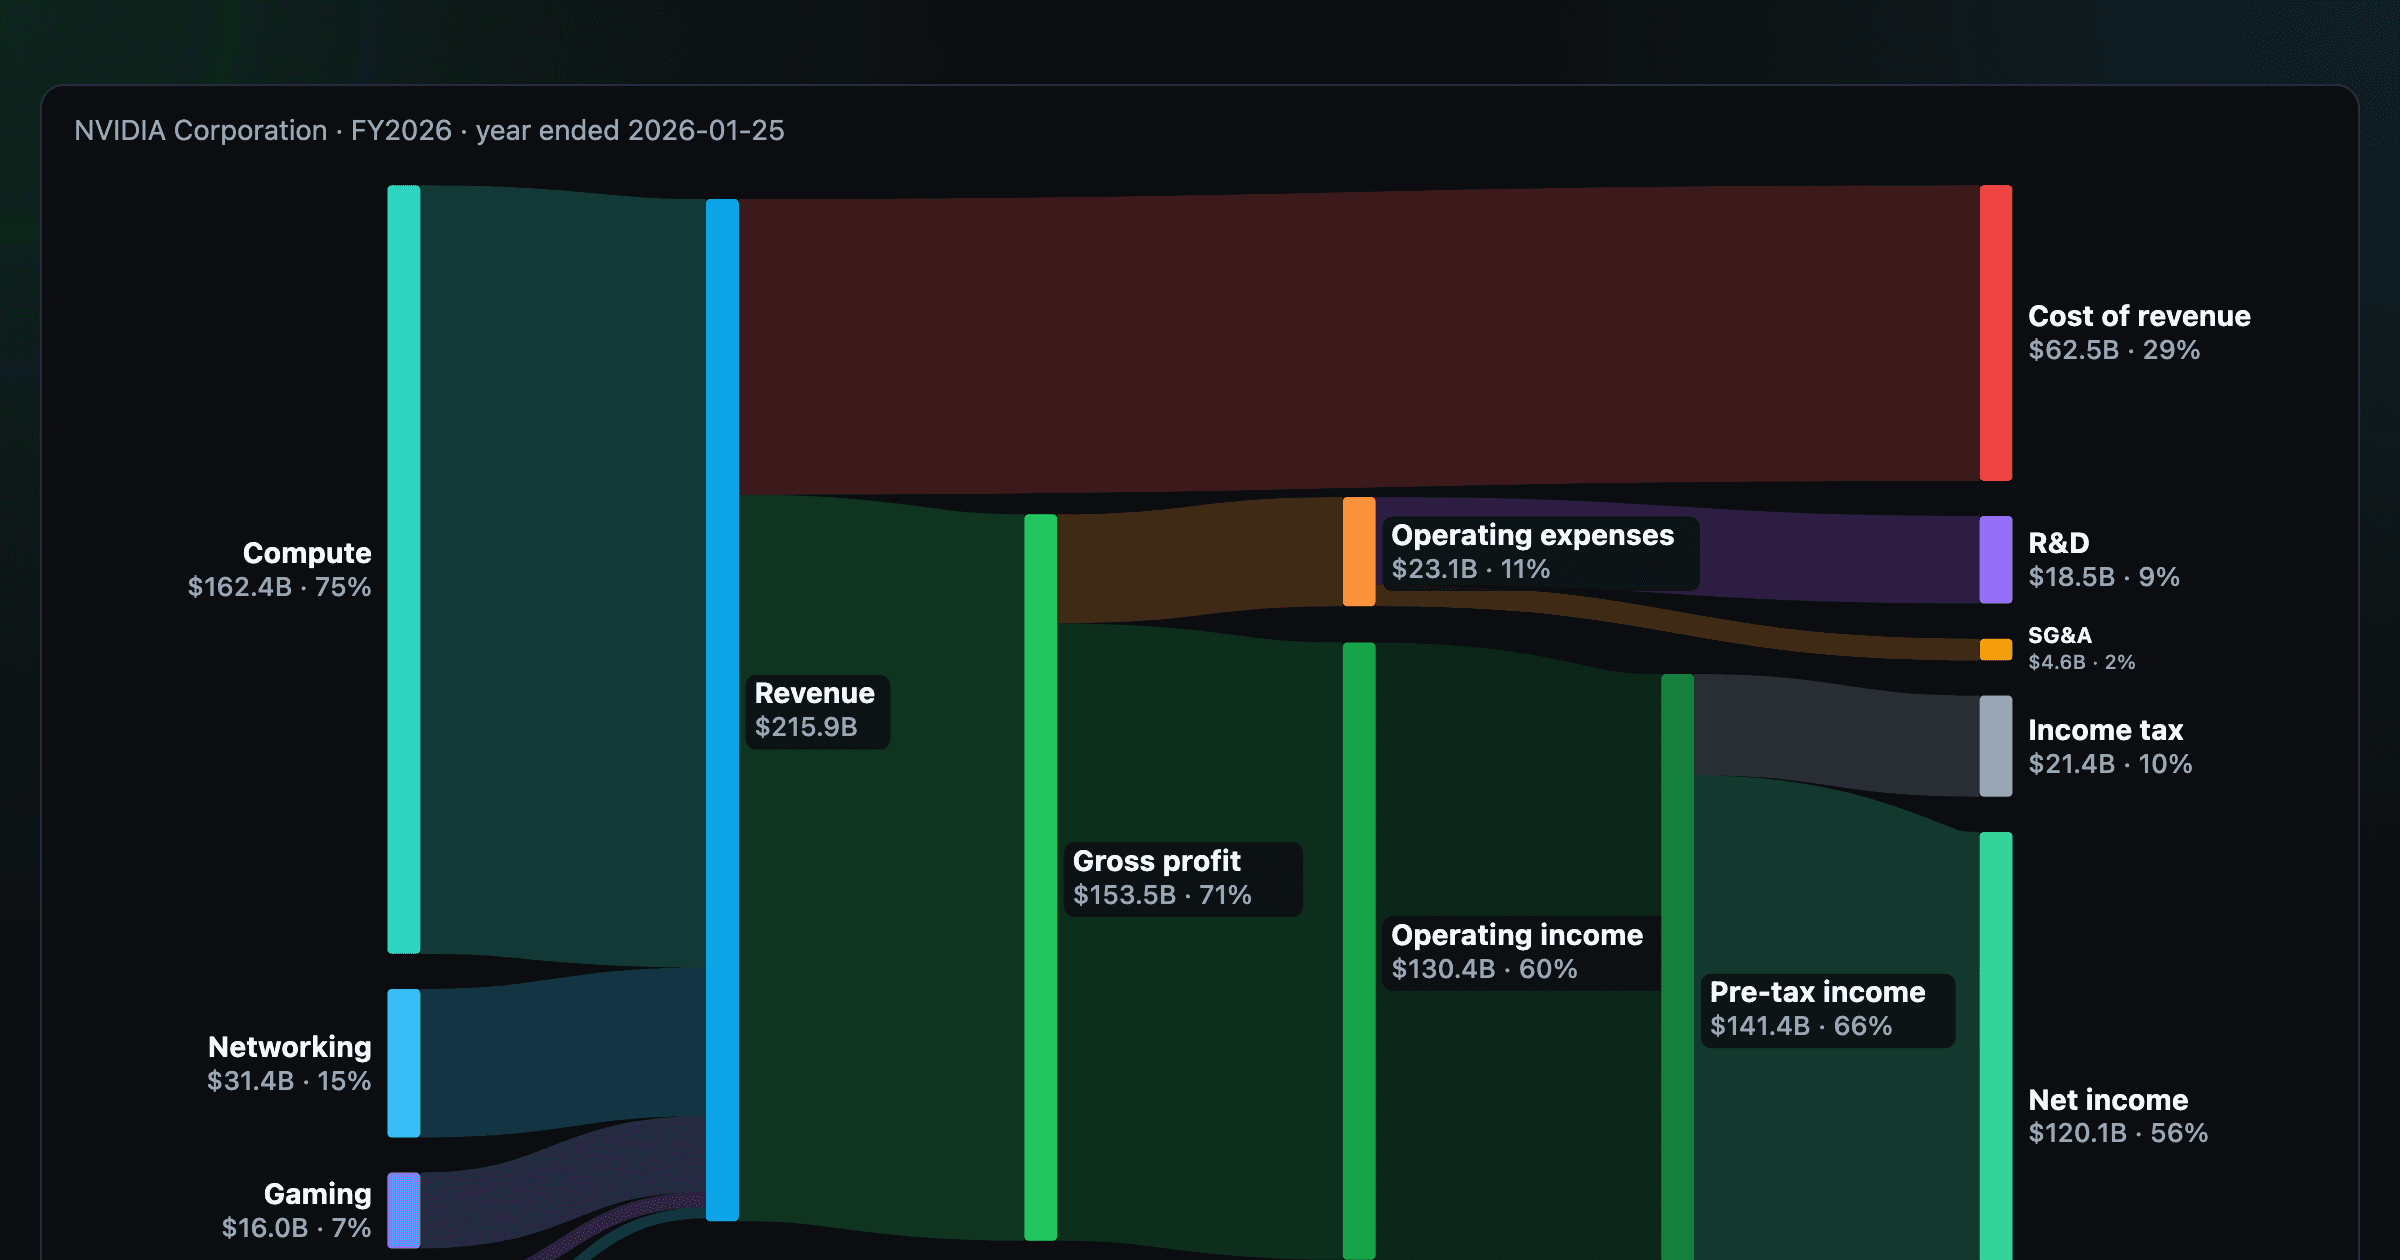
Follow a company's revenue through its income statement as a Sankey — costs, taxes, and profit.
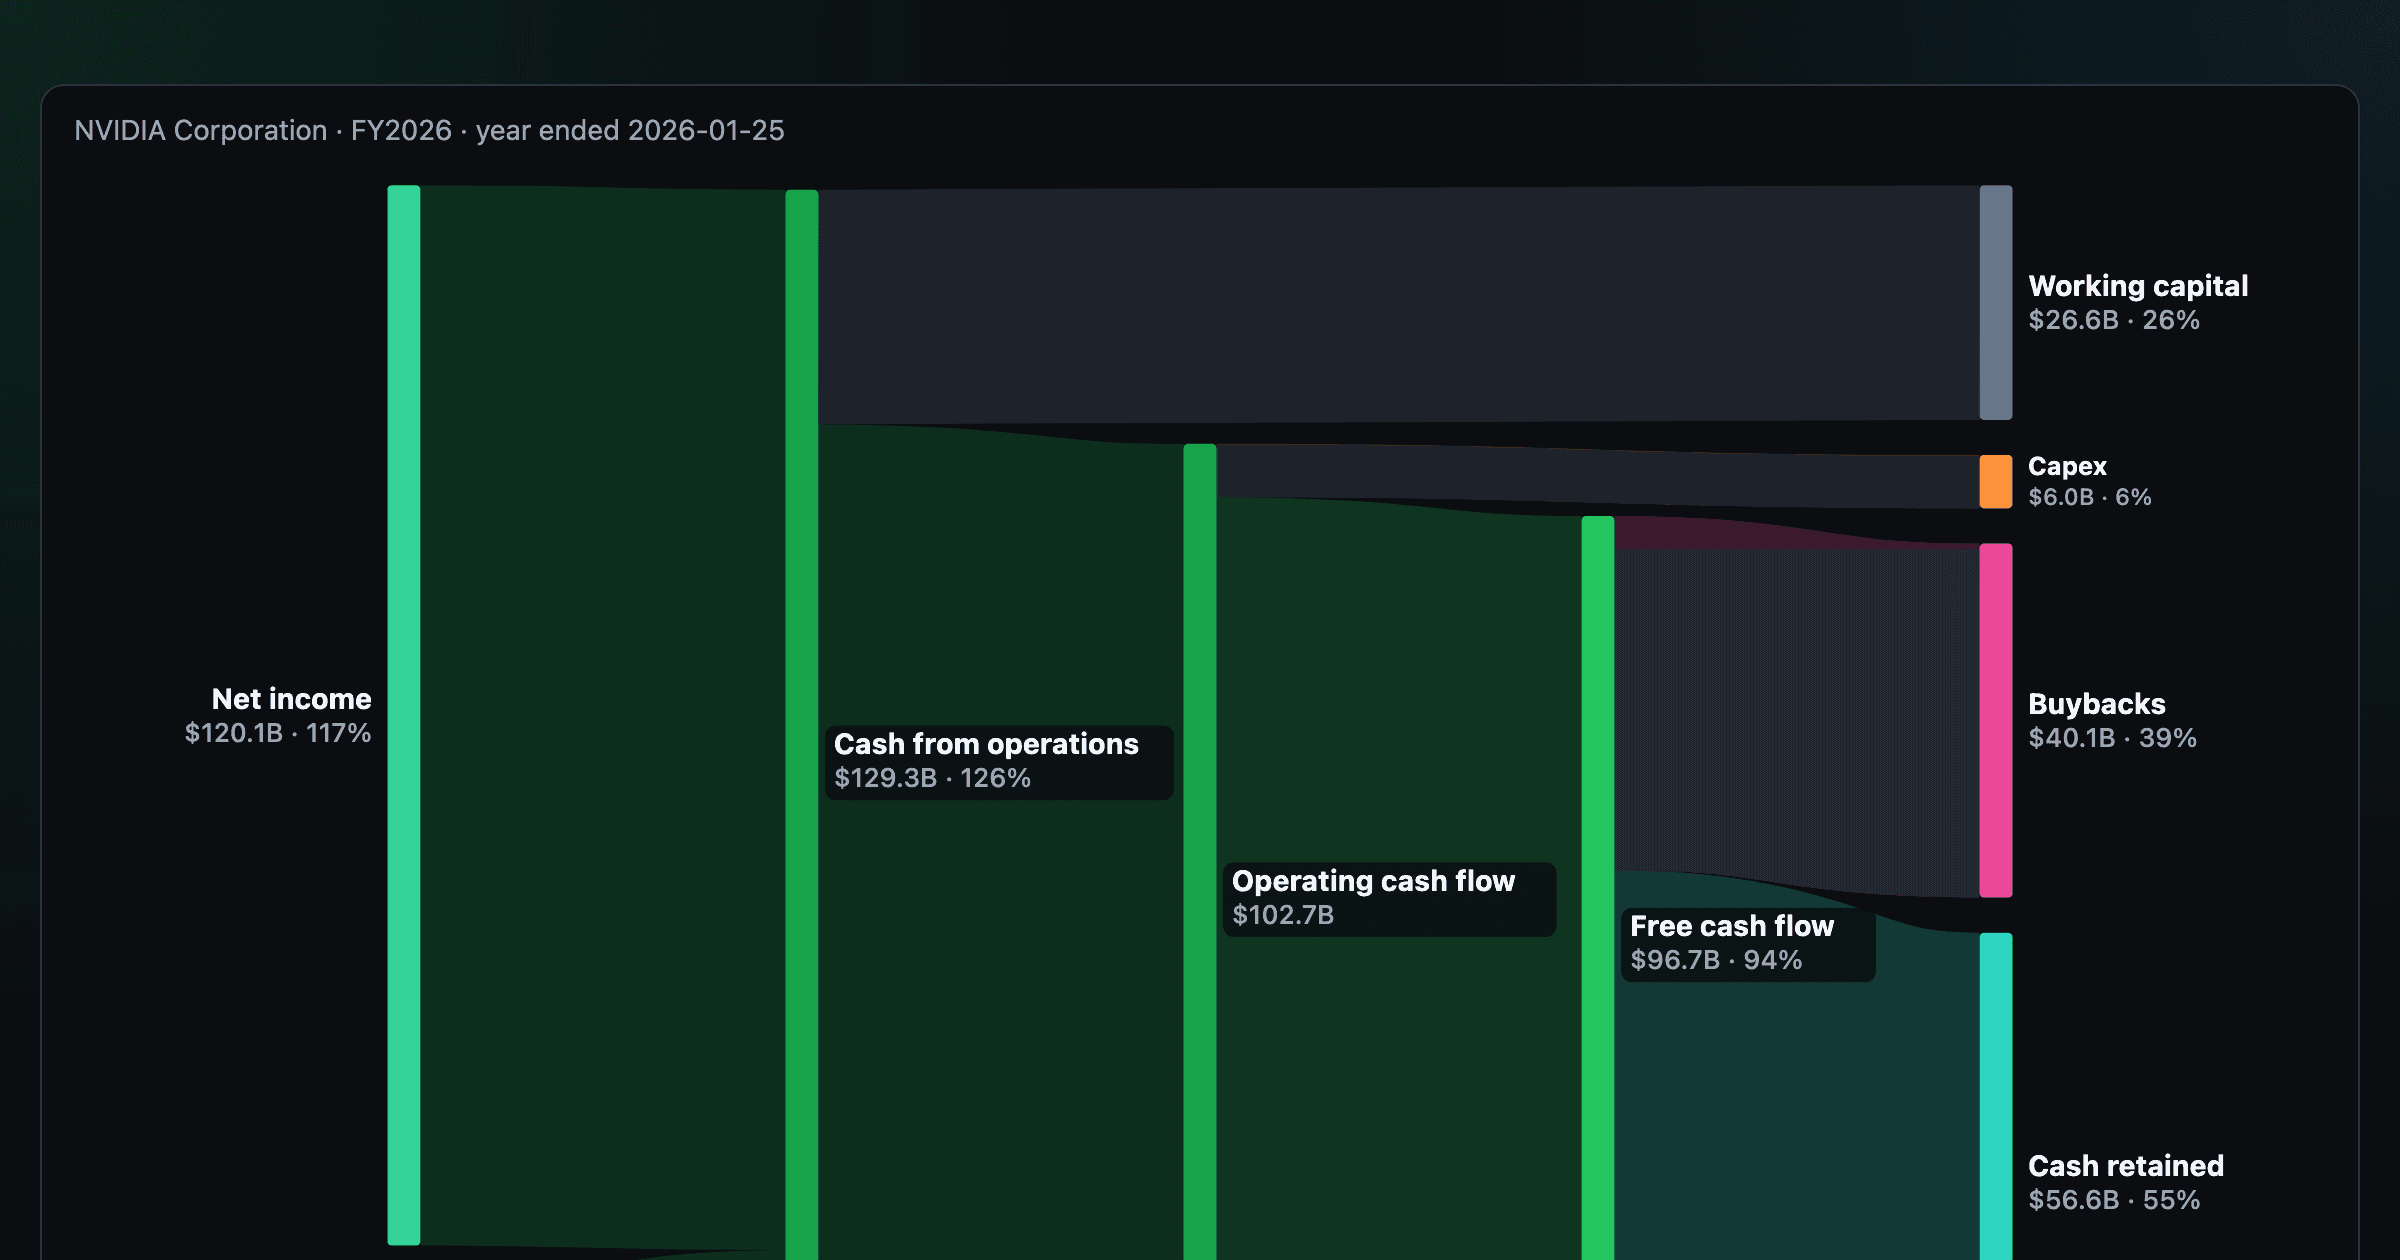
Follow a company's cash from net income through operating cash flow into capex, buybacks, and dividends.
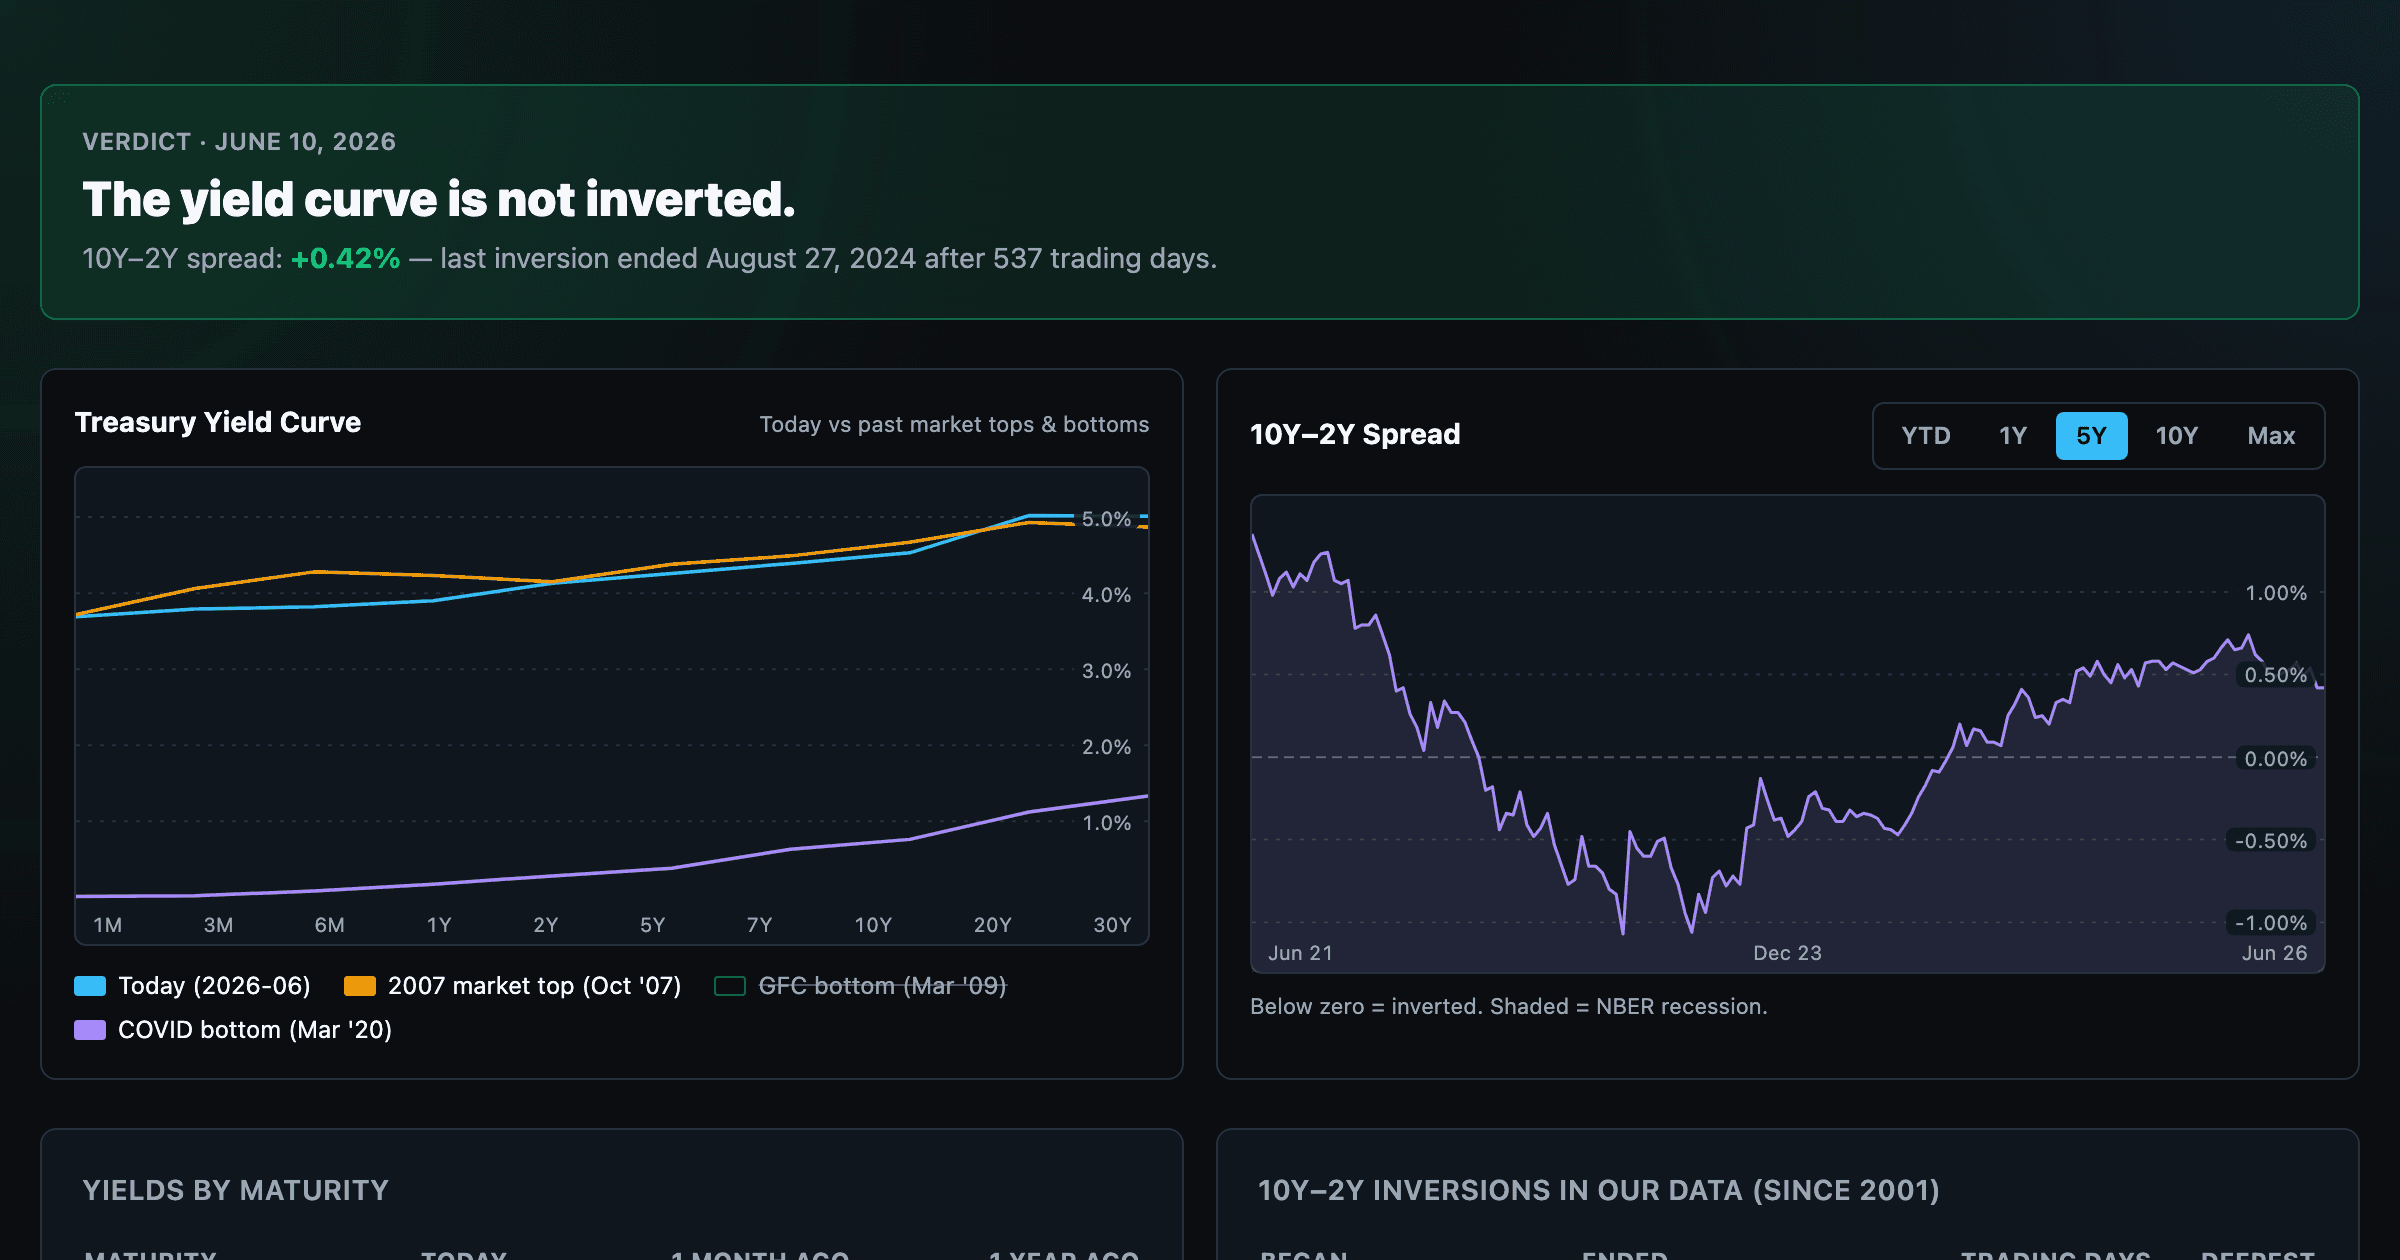
Live term structure, the 10Y–2Y spread, and every inversion episode.