
If you invested in
A $1,000 investment in Allstate Corporation (The) (ALL) in January 2016 would be worth $4,590 as of June 2026 with dividends reinvested — 15.8% a year. Use the dropdowns above to try any amount, ticker, or starting month back to June 1993.
Over the same period, the same $1,000 would be worth $4,557 in the S&P 500 (SPY) and $7,667 in the Nasdaq-100 (QQQ). ALL beat the S&P 500 but trailed the Nasdaq-100 over that period.
Growth of $1,000 in ALL since January 2016#
monthlyAllstate Corporation (The) (ALL). Total return approximated via dividend- and split-adjusted closes (no taxes or fees). Not investment advice.
Growth of $1,000 in ALL by starting month#
$1,000 invested in ALL, by starting year#
| Invested in | Worth today | Same in QQQ | Multiple | Annualized |
|---|---|---|---|---|
| 2016 | $4,590 | $7,667 | 4.6× | 15.8% |
| 2017 | $3,627 | $6,338 | 3.6× | 14.7% |
| 2018 | $2,716 | $4,619 | 2.7× | 12.7% |
| 2019 | $2,994 | $4,614 | 3.0× | 16.0% |
| 2020 | $2,176 | $3,513 | 2.2× | 13.0% |
| 2021 | $2,356 | $2,429 | 2.4× | 17.3% |
| 2022 | $2,039 | $2,095 | 2.0× | 17.7% |
| 2023 | $1,865 | $2,562 | 1.9× | 20.3% |
| 2024 | $1,498 | $1,798 | 1.5× | 18.5% |
| 2025 | $1,184 | $1,427 | 1.2× | 13.1% |
Methodology#
Investments are assumed made at the first trading day's close of the chosen year. "Dividends reinvested" uses split- and dividend-adjusted closes (a standard total-return approximation; taxes and fees excluded). "Price-only" uses split-adjusted closes. ALL data begins June 1993; values as of June 2026 and refresh daily. Past performance does not predict future returns; not investment advice.
See the live ALL chart and fundamentals on the ALL quote page or compare with the same investment in SPY.
FAQ
- How much would $1,000 invested in ALL be worth today?
- A $1,000 investment in Allstate Corporation (The) (ALL) in January 2016 would be worth about $4,590 as of June 2026, with dividends reinvested. That works out to about 15.8% a year.
- How far back does the ALL calculation go?
- ALL data begins June 1993. You can pick any starting month from then to the present and see what your investment would be worth today.
- Does this include dividends?
- Yes. The default "dividends reinvested" view uses split- and dividend-adjusted closing prices — a standard total-return approximation that excludes taxes and fees. A price-only view (split-adjusted, no dividends) is also available.
More visualizations
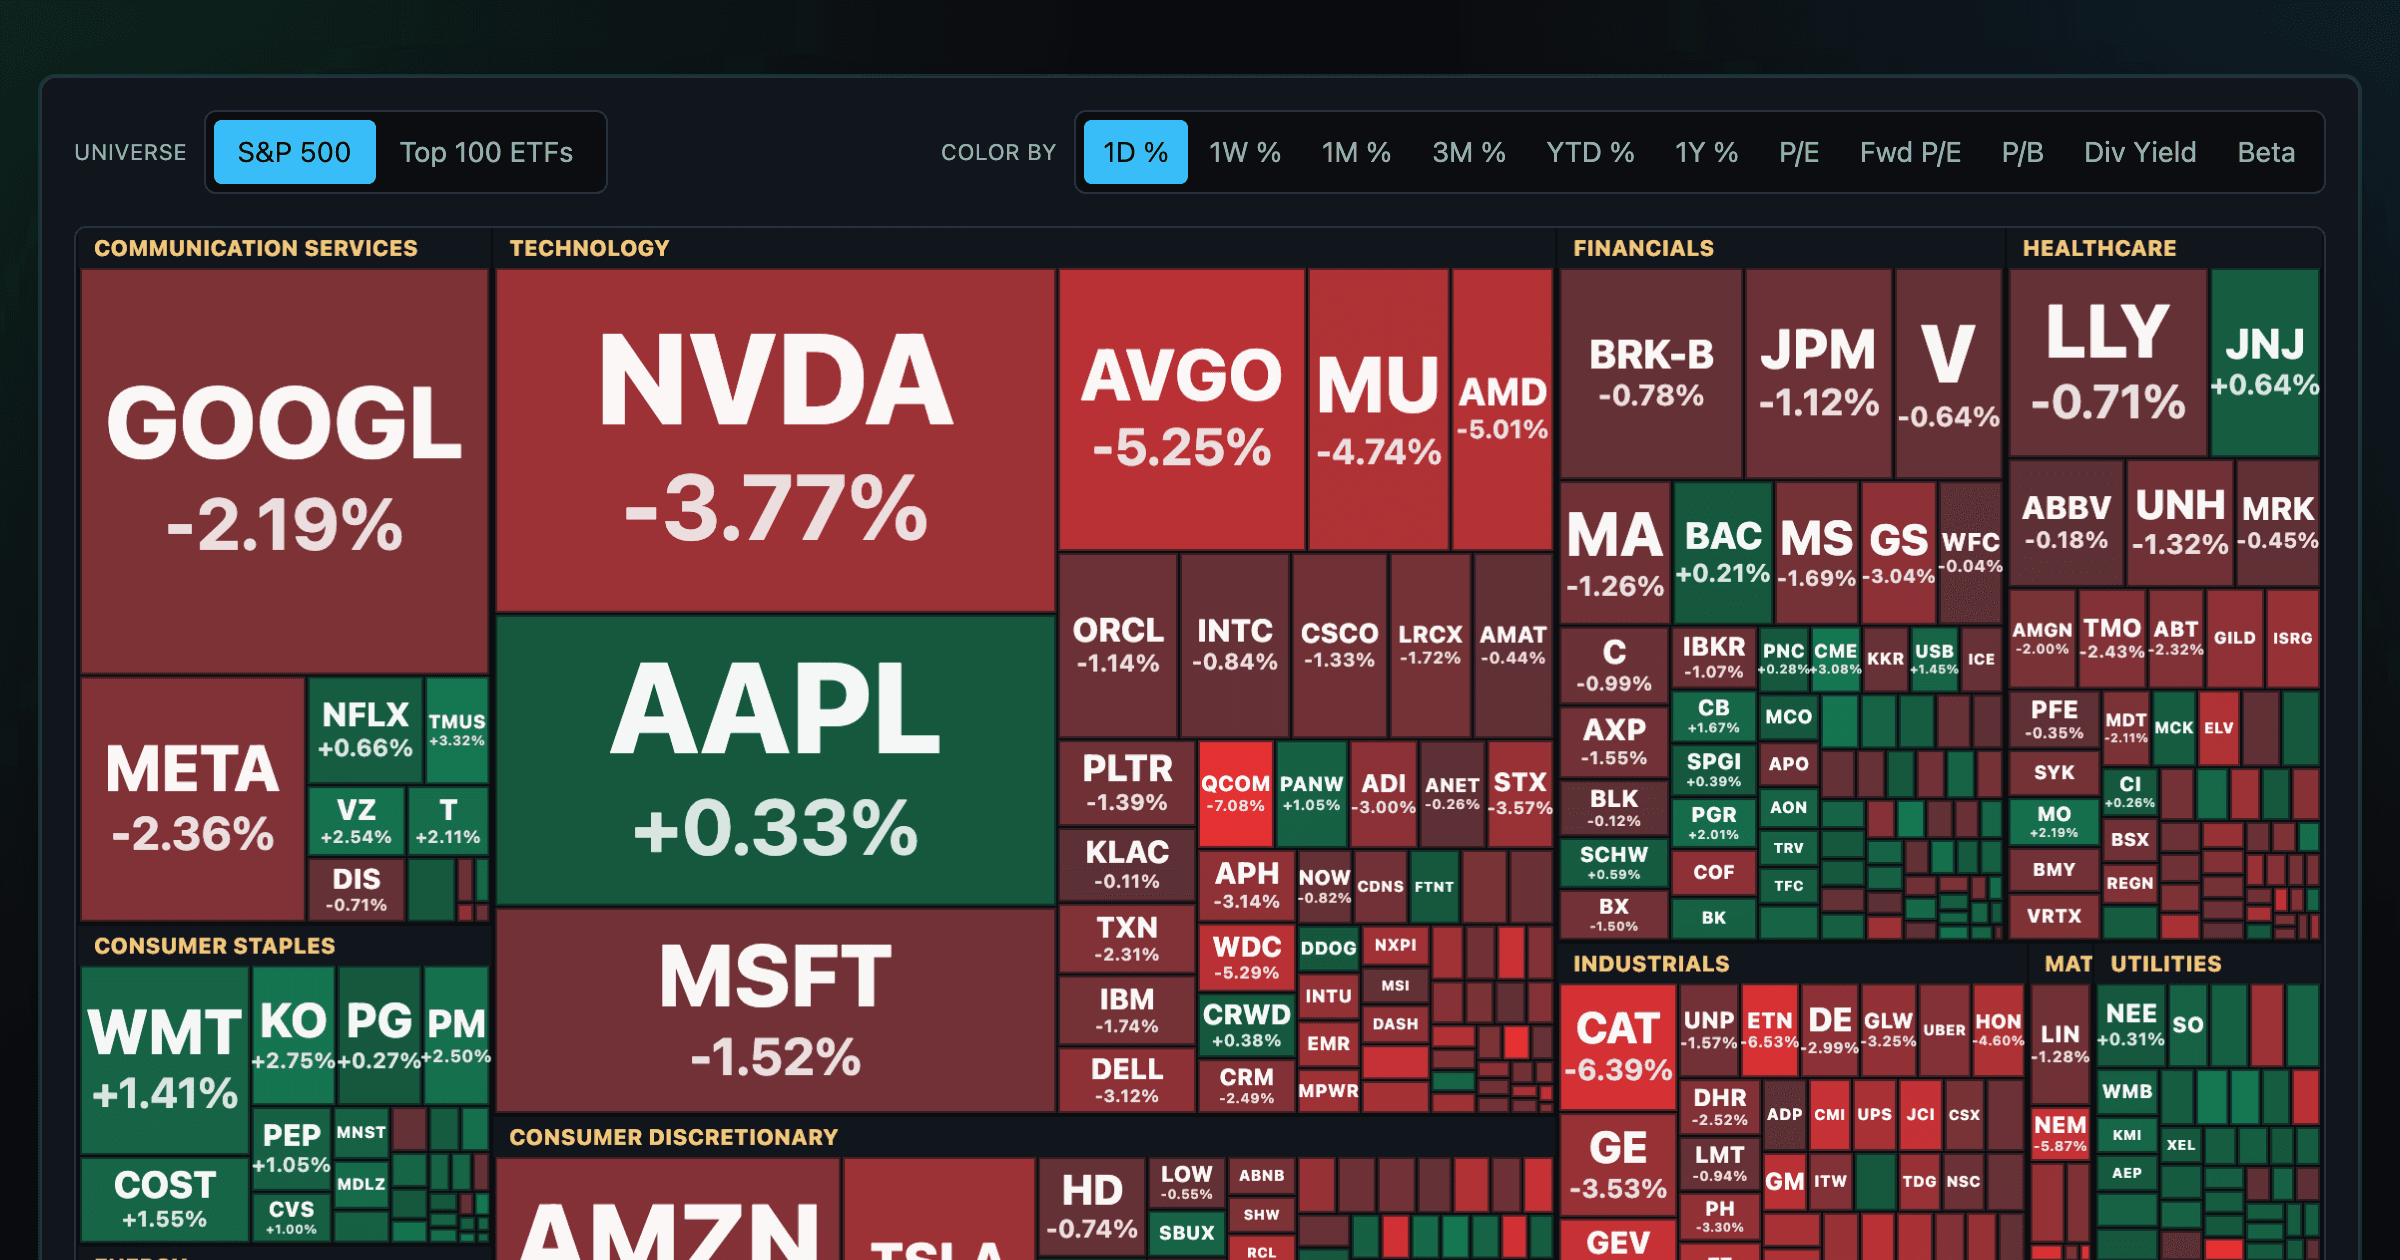
Every S&P 500 company sized by market cap — color by return or valuation.
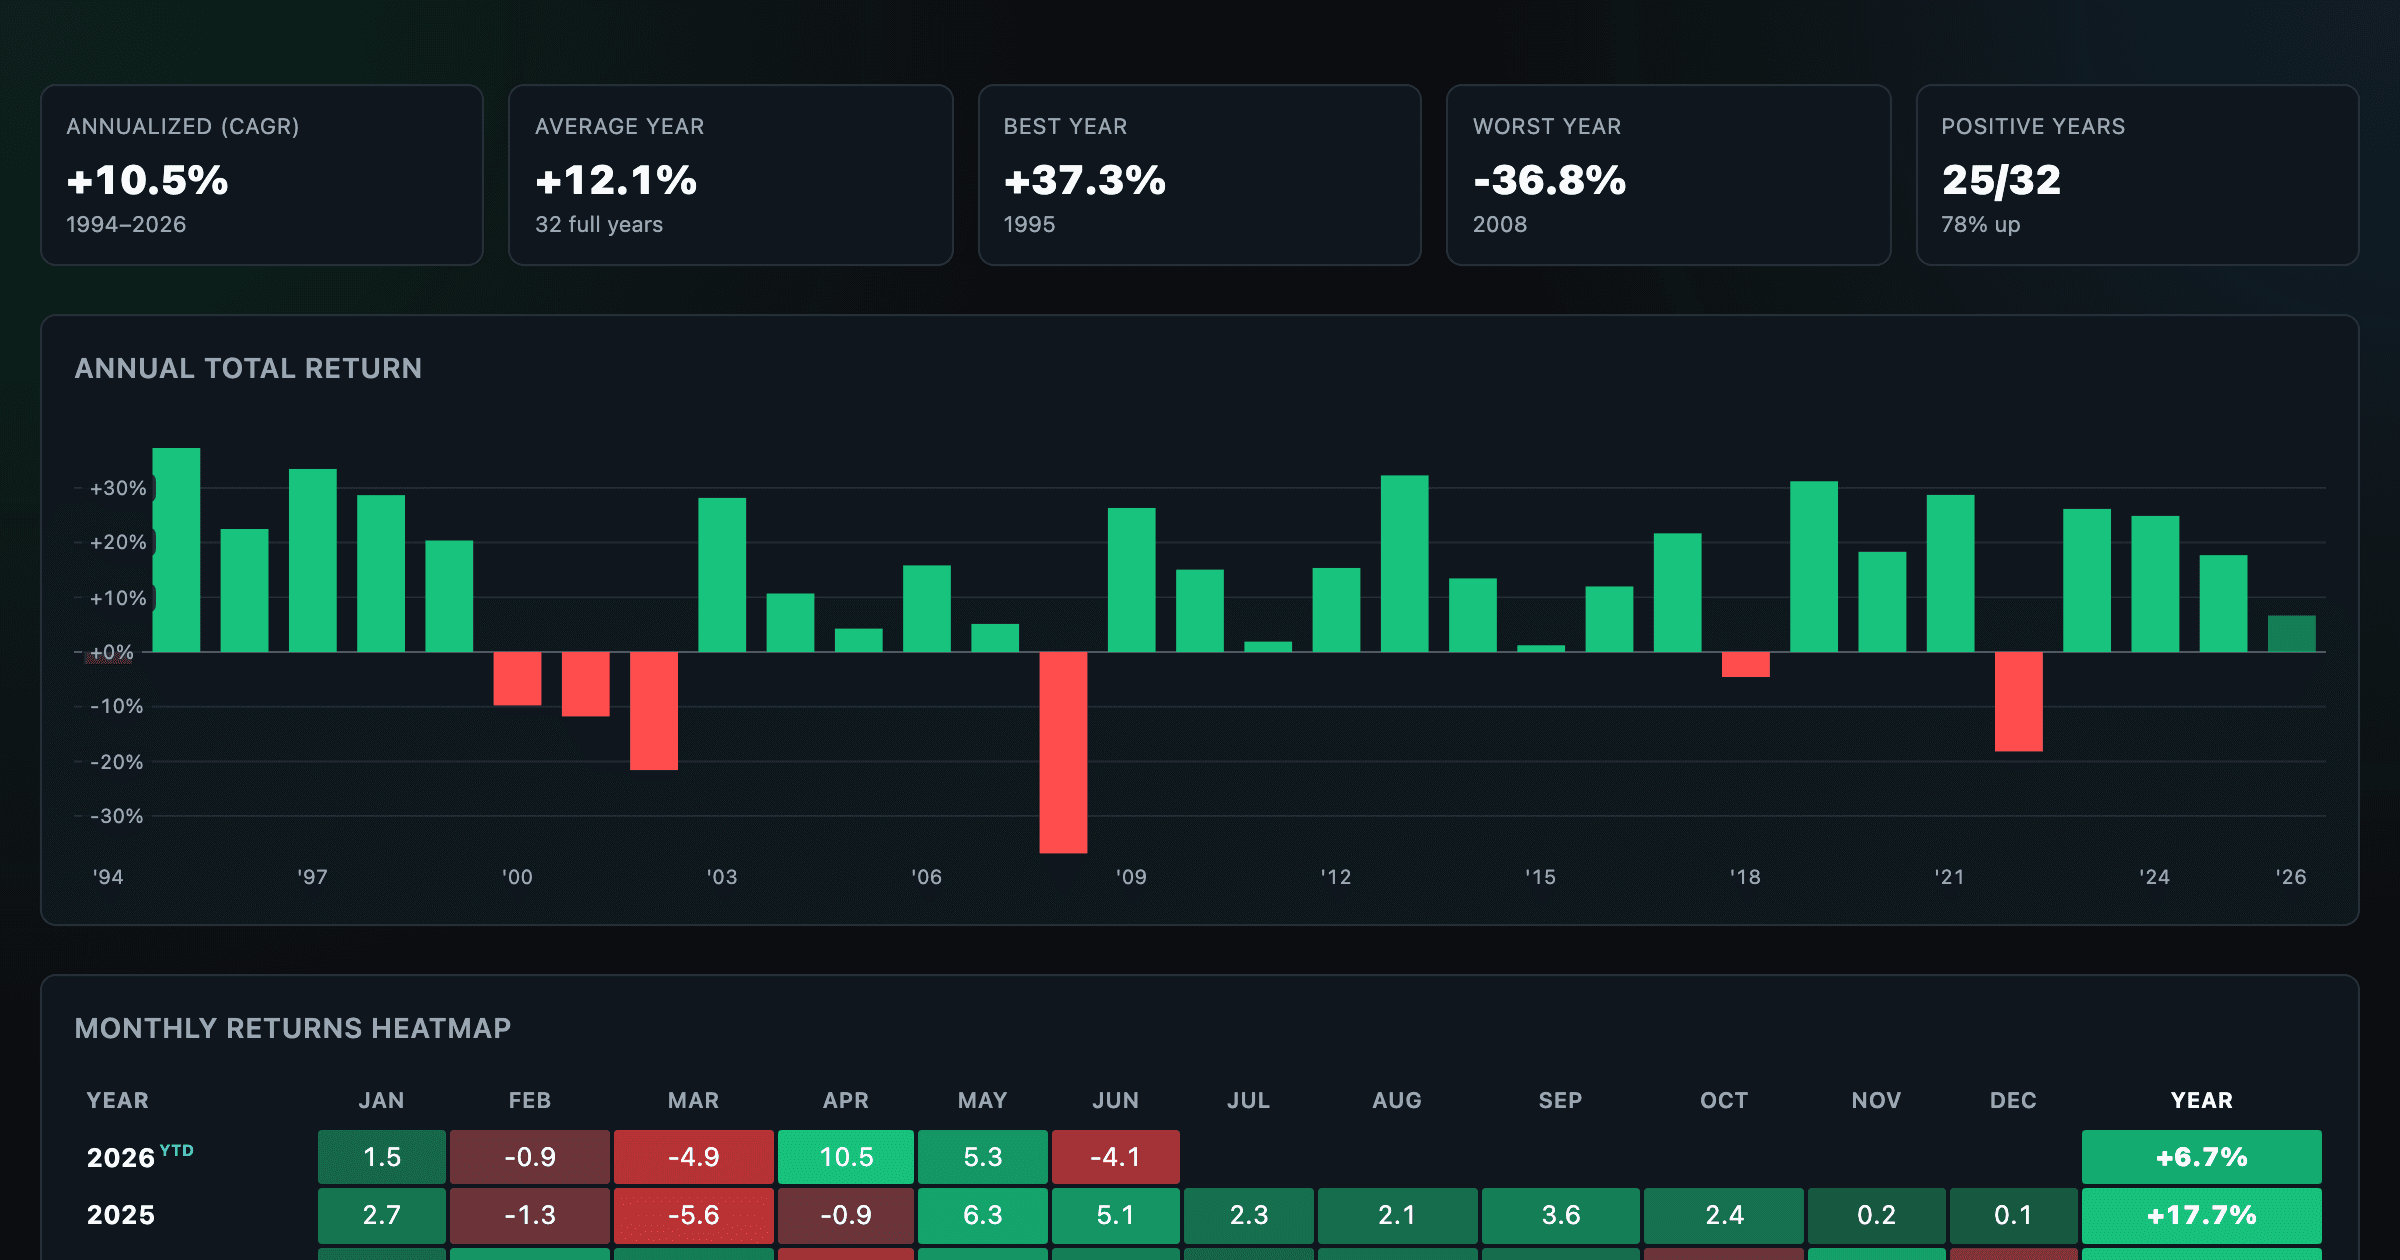
S&P 500 annual and monthly returns — every year, every month.
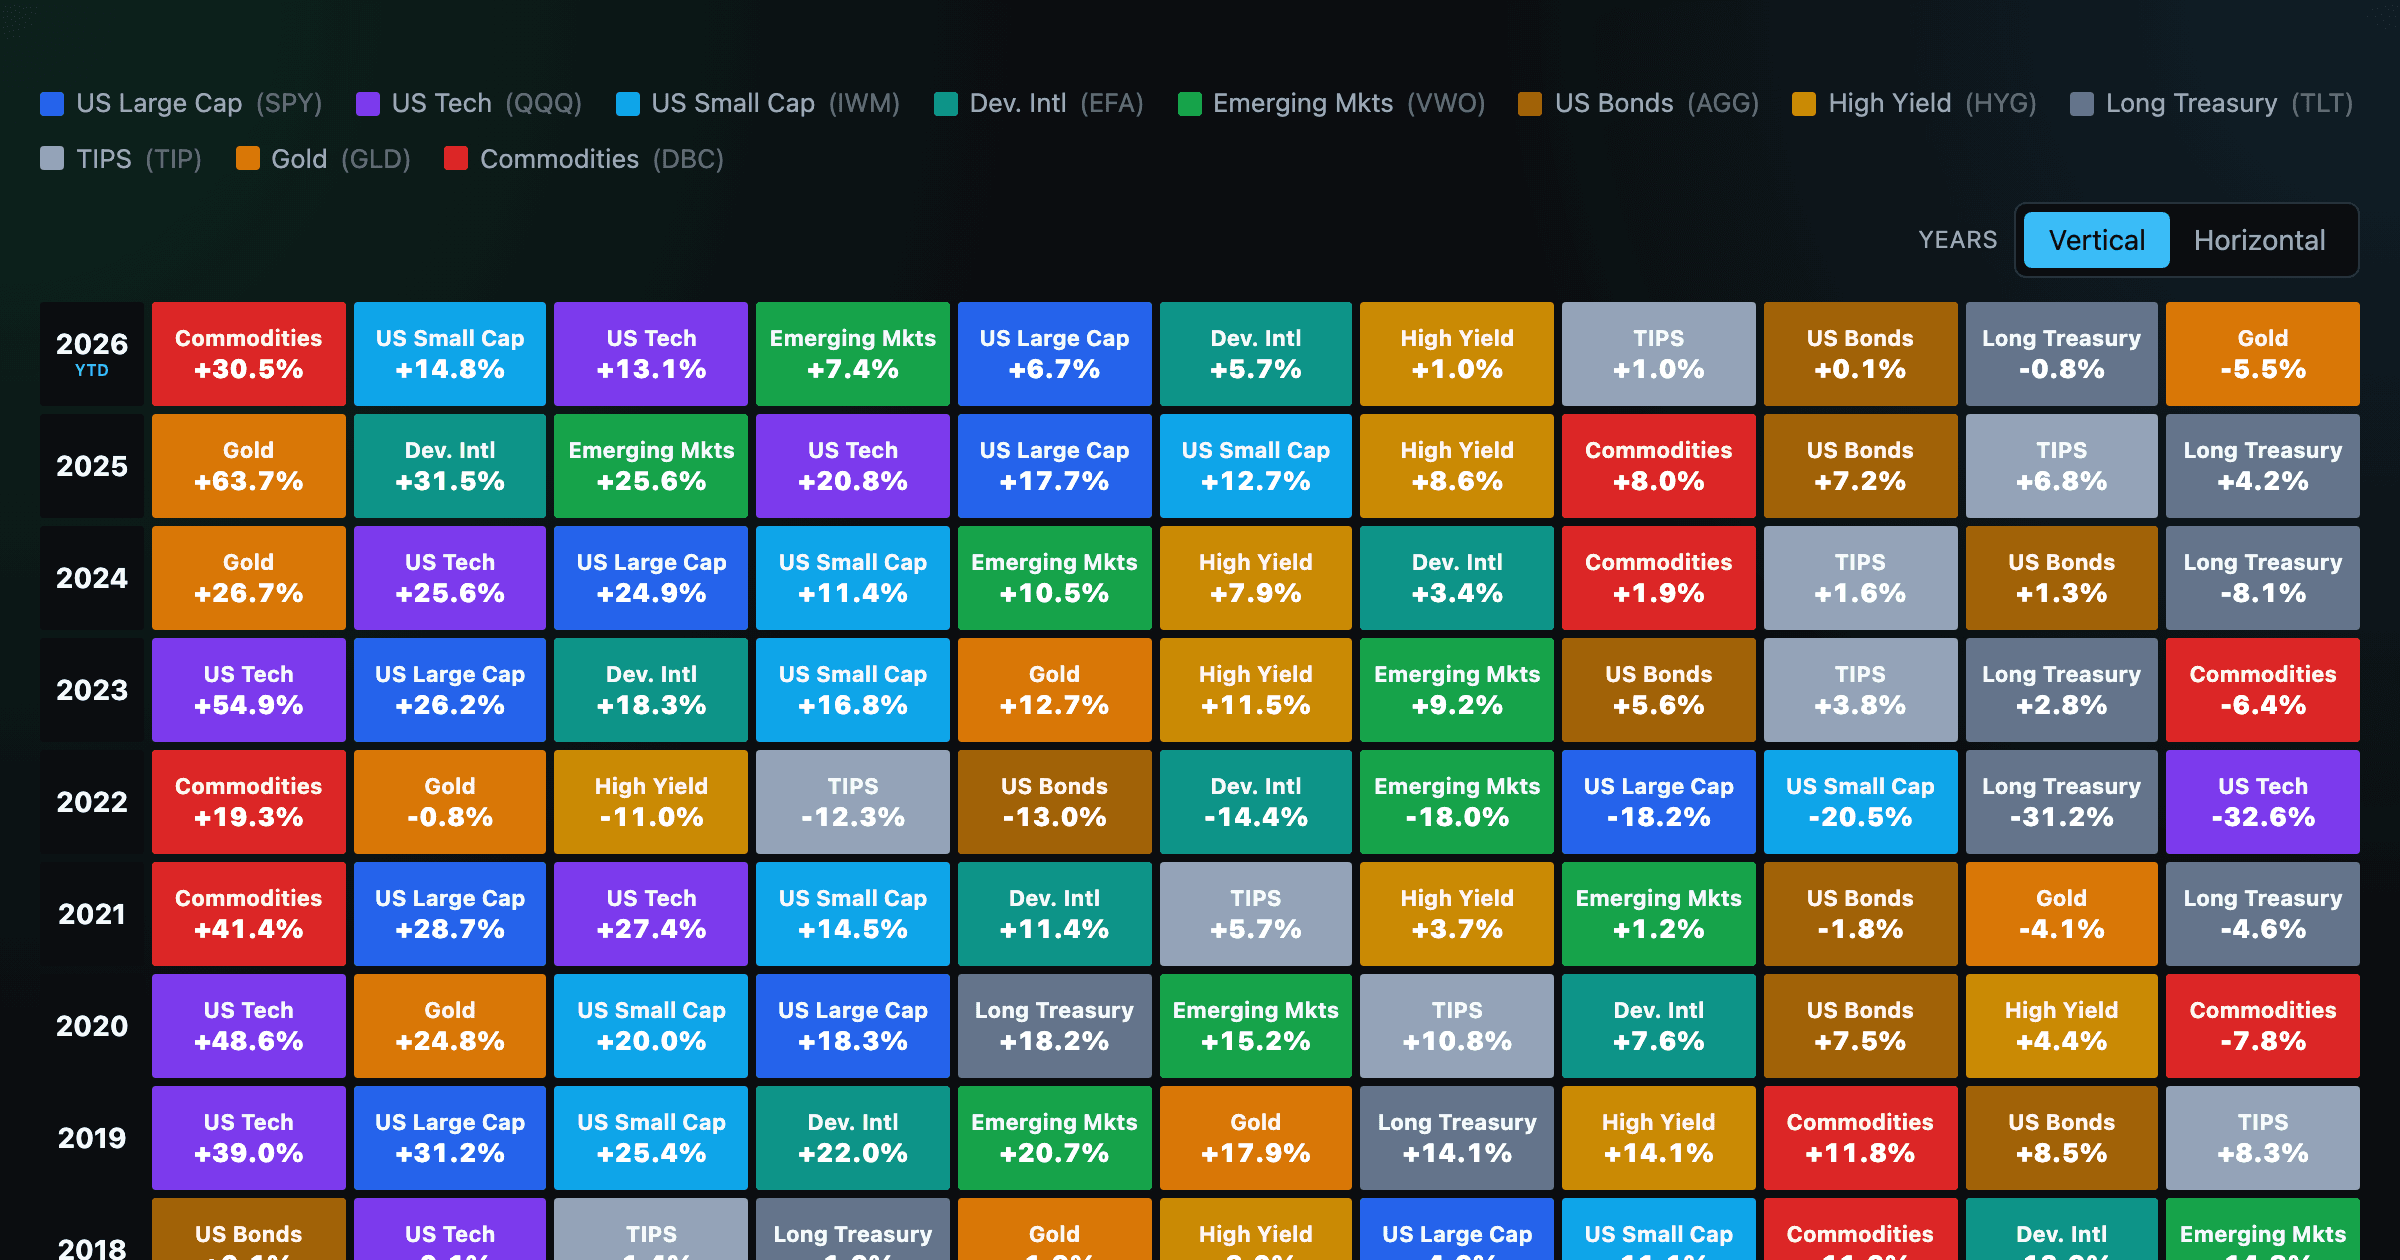
Asset-class returns ranked year by year — the Callan chart / asset allocation quilt.
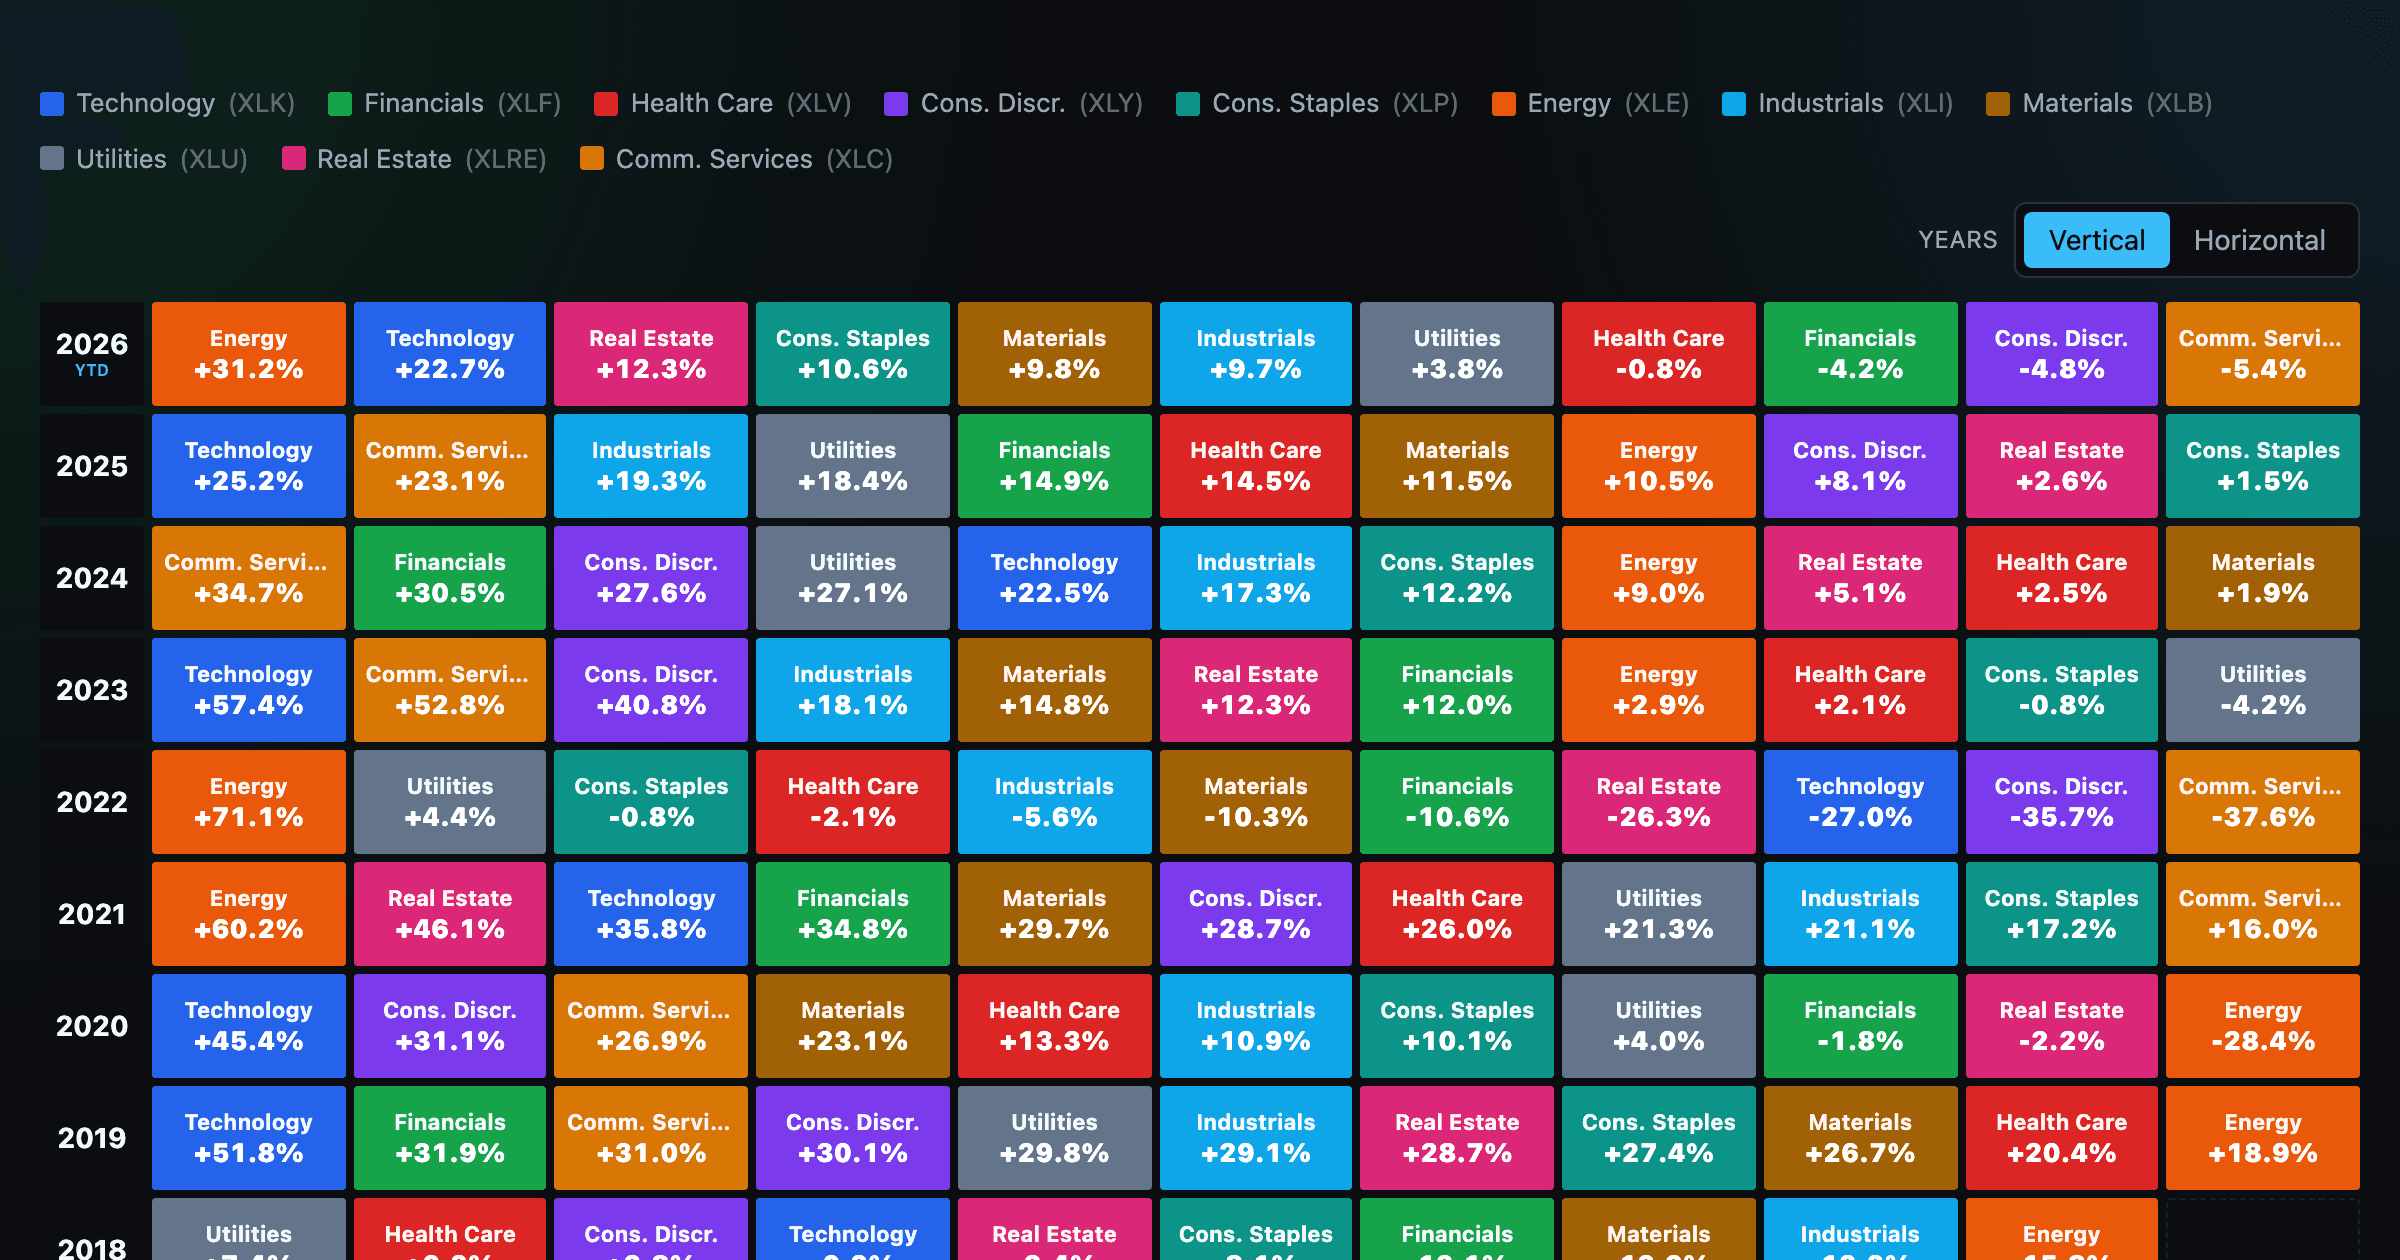
The 11 S&P 500 sectors ranked year by year — a sector quilt chart, back to 1999.
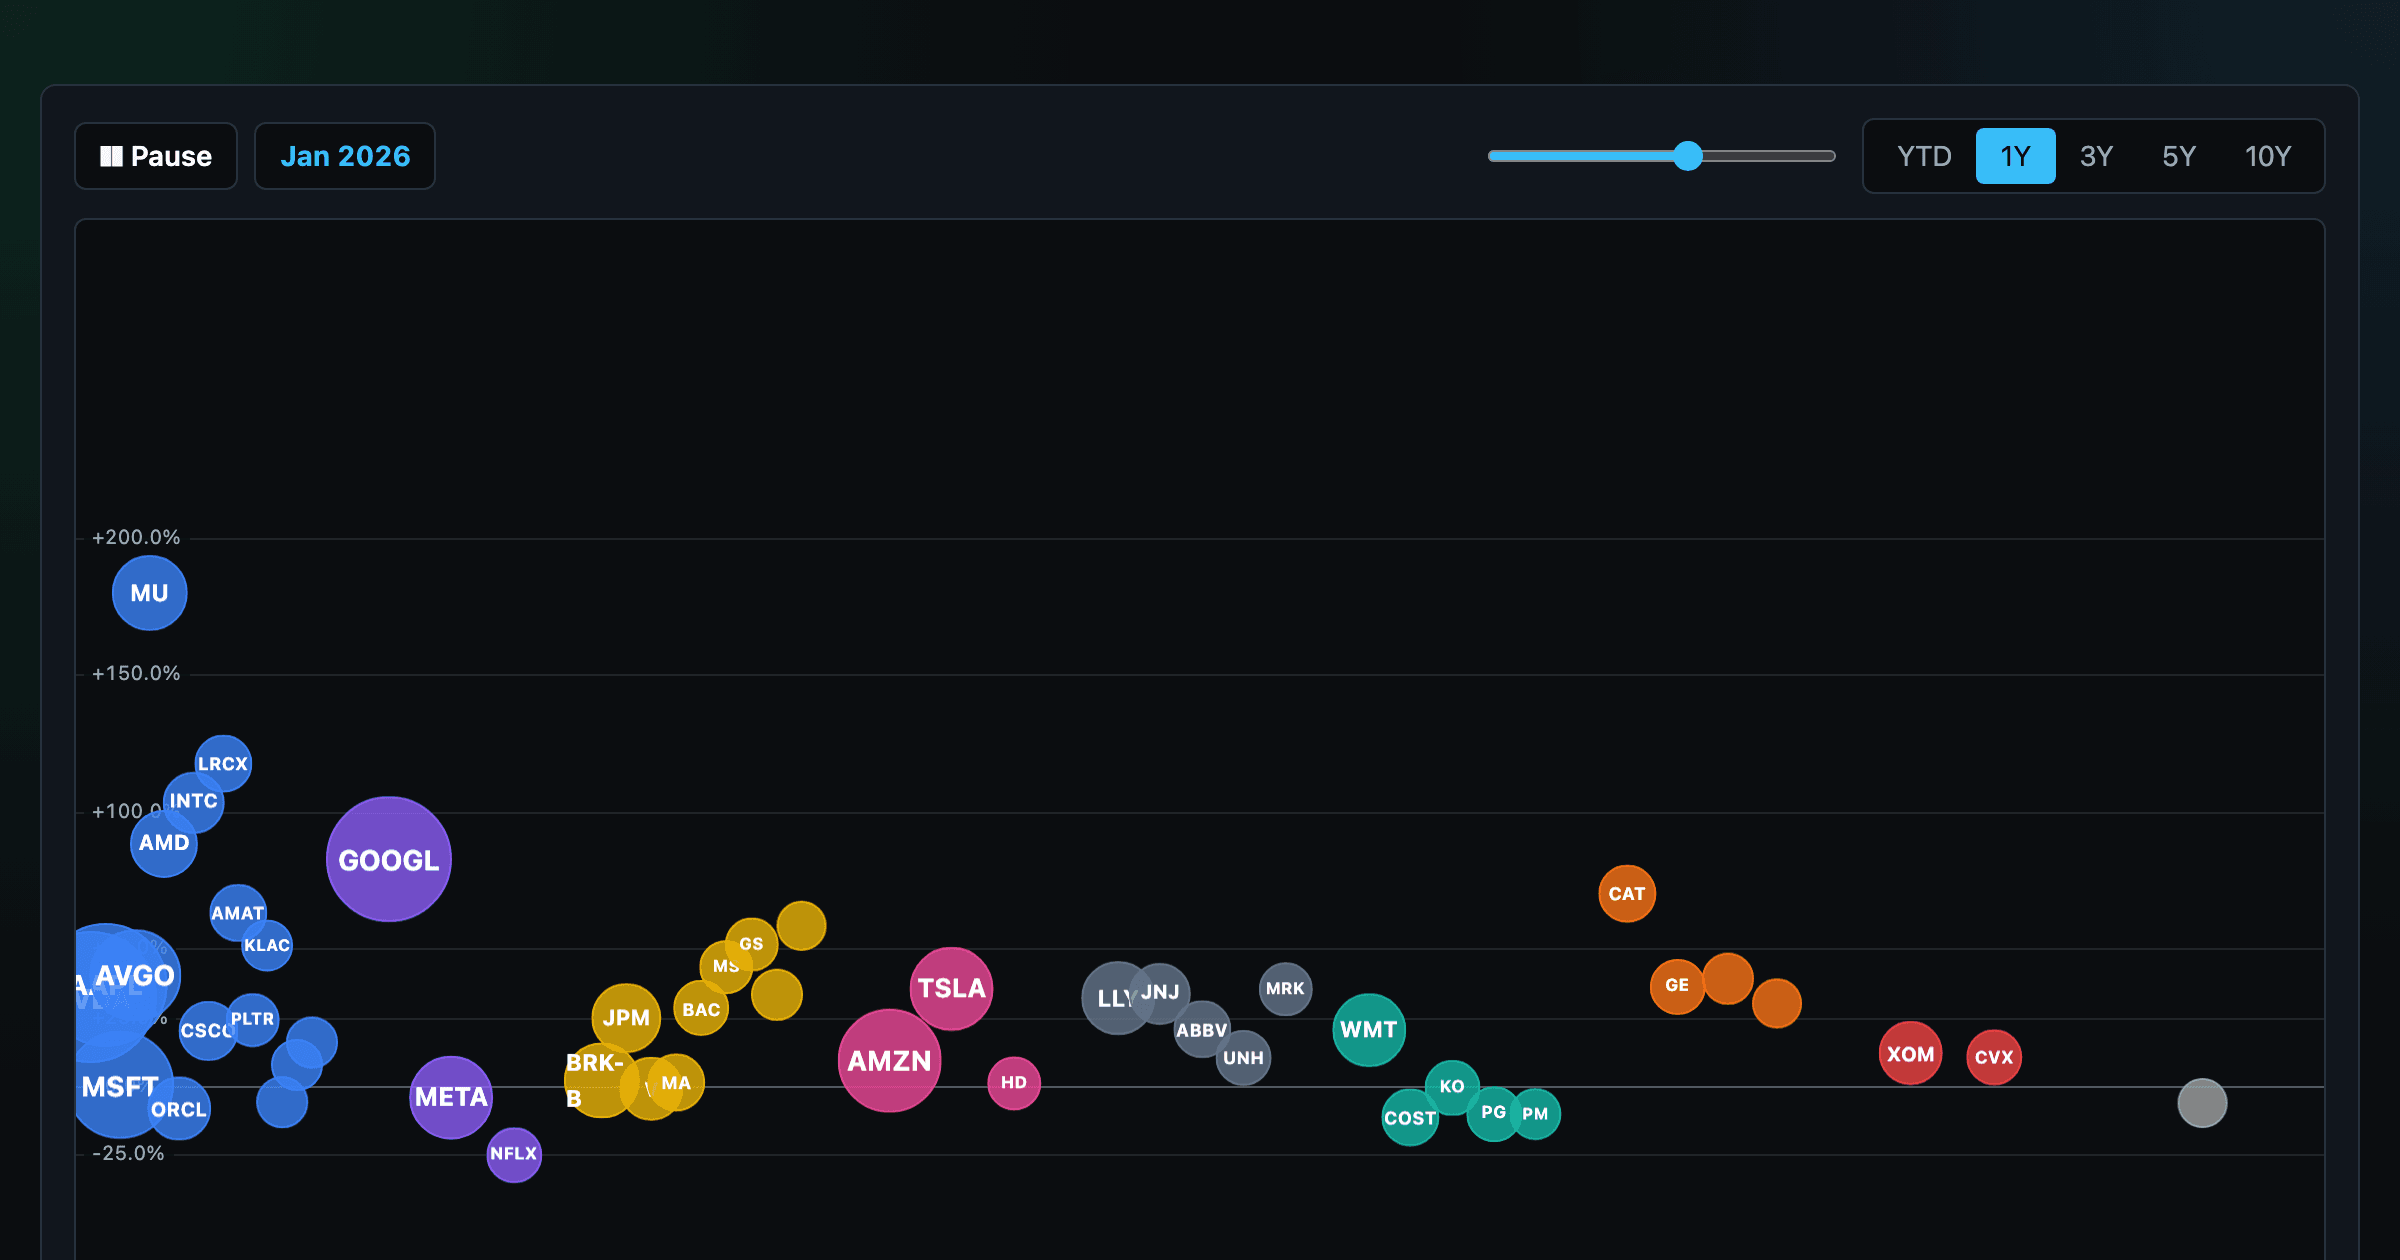
The biggest US companies as animated bubbles, rising and falling with their total return over time.
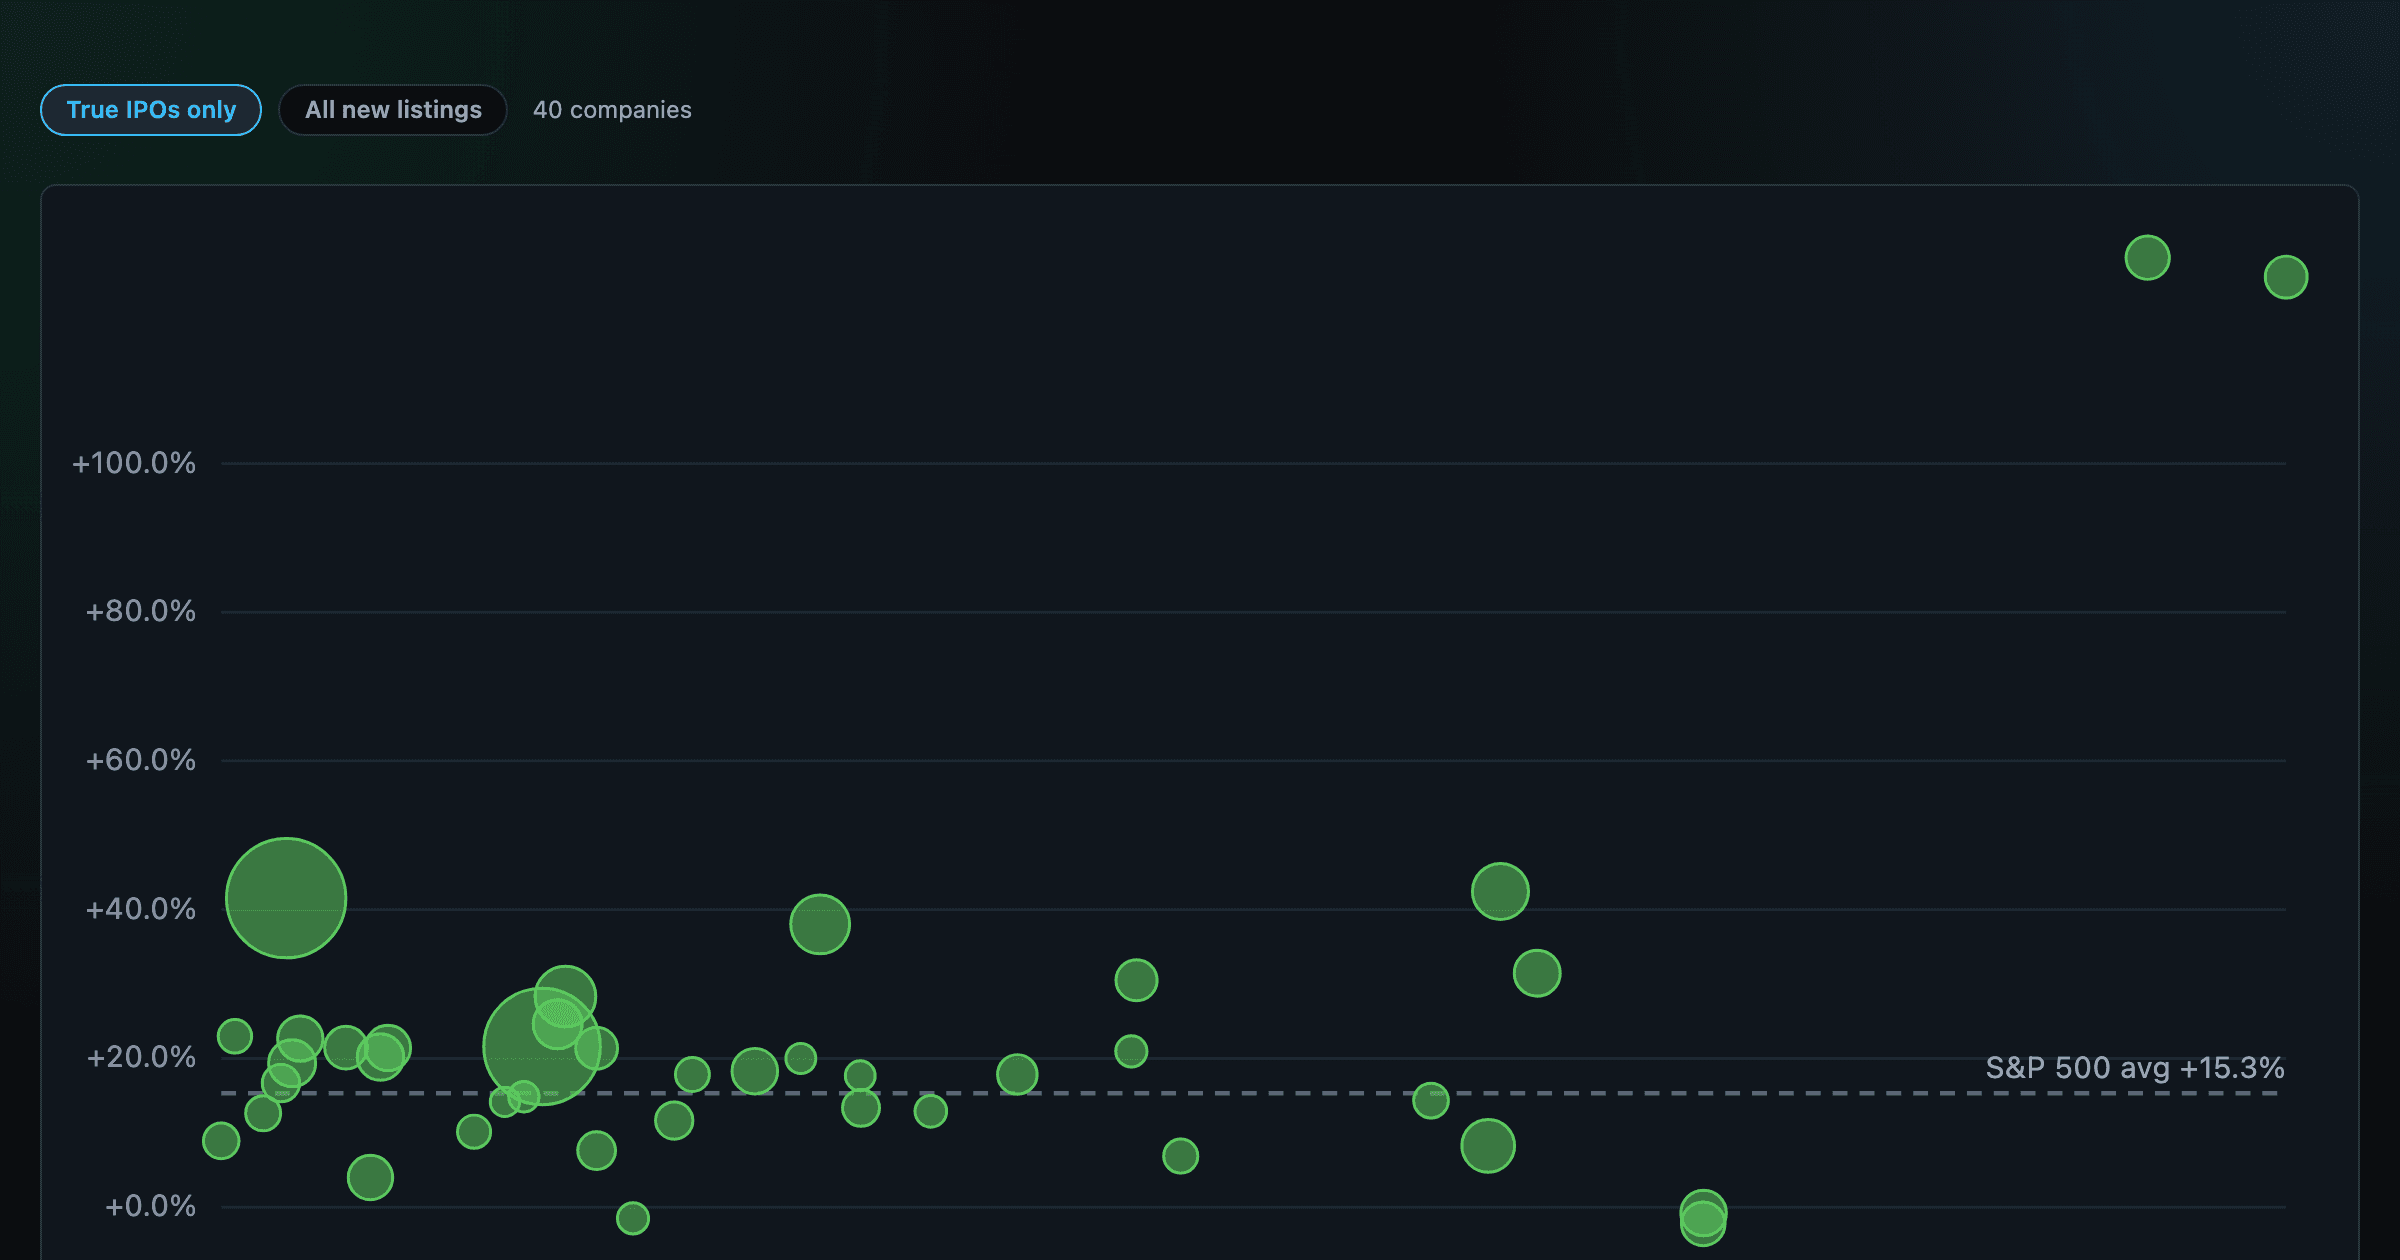
How recent stock-market debuts have performed since listing — annualized, vs the S&P 500, by IPO vs spin-off.
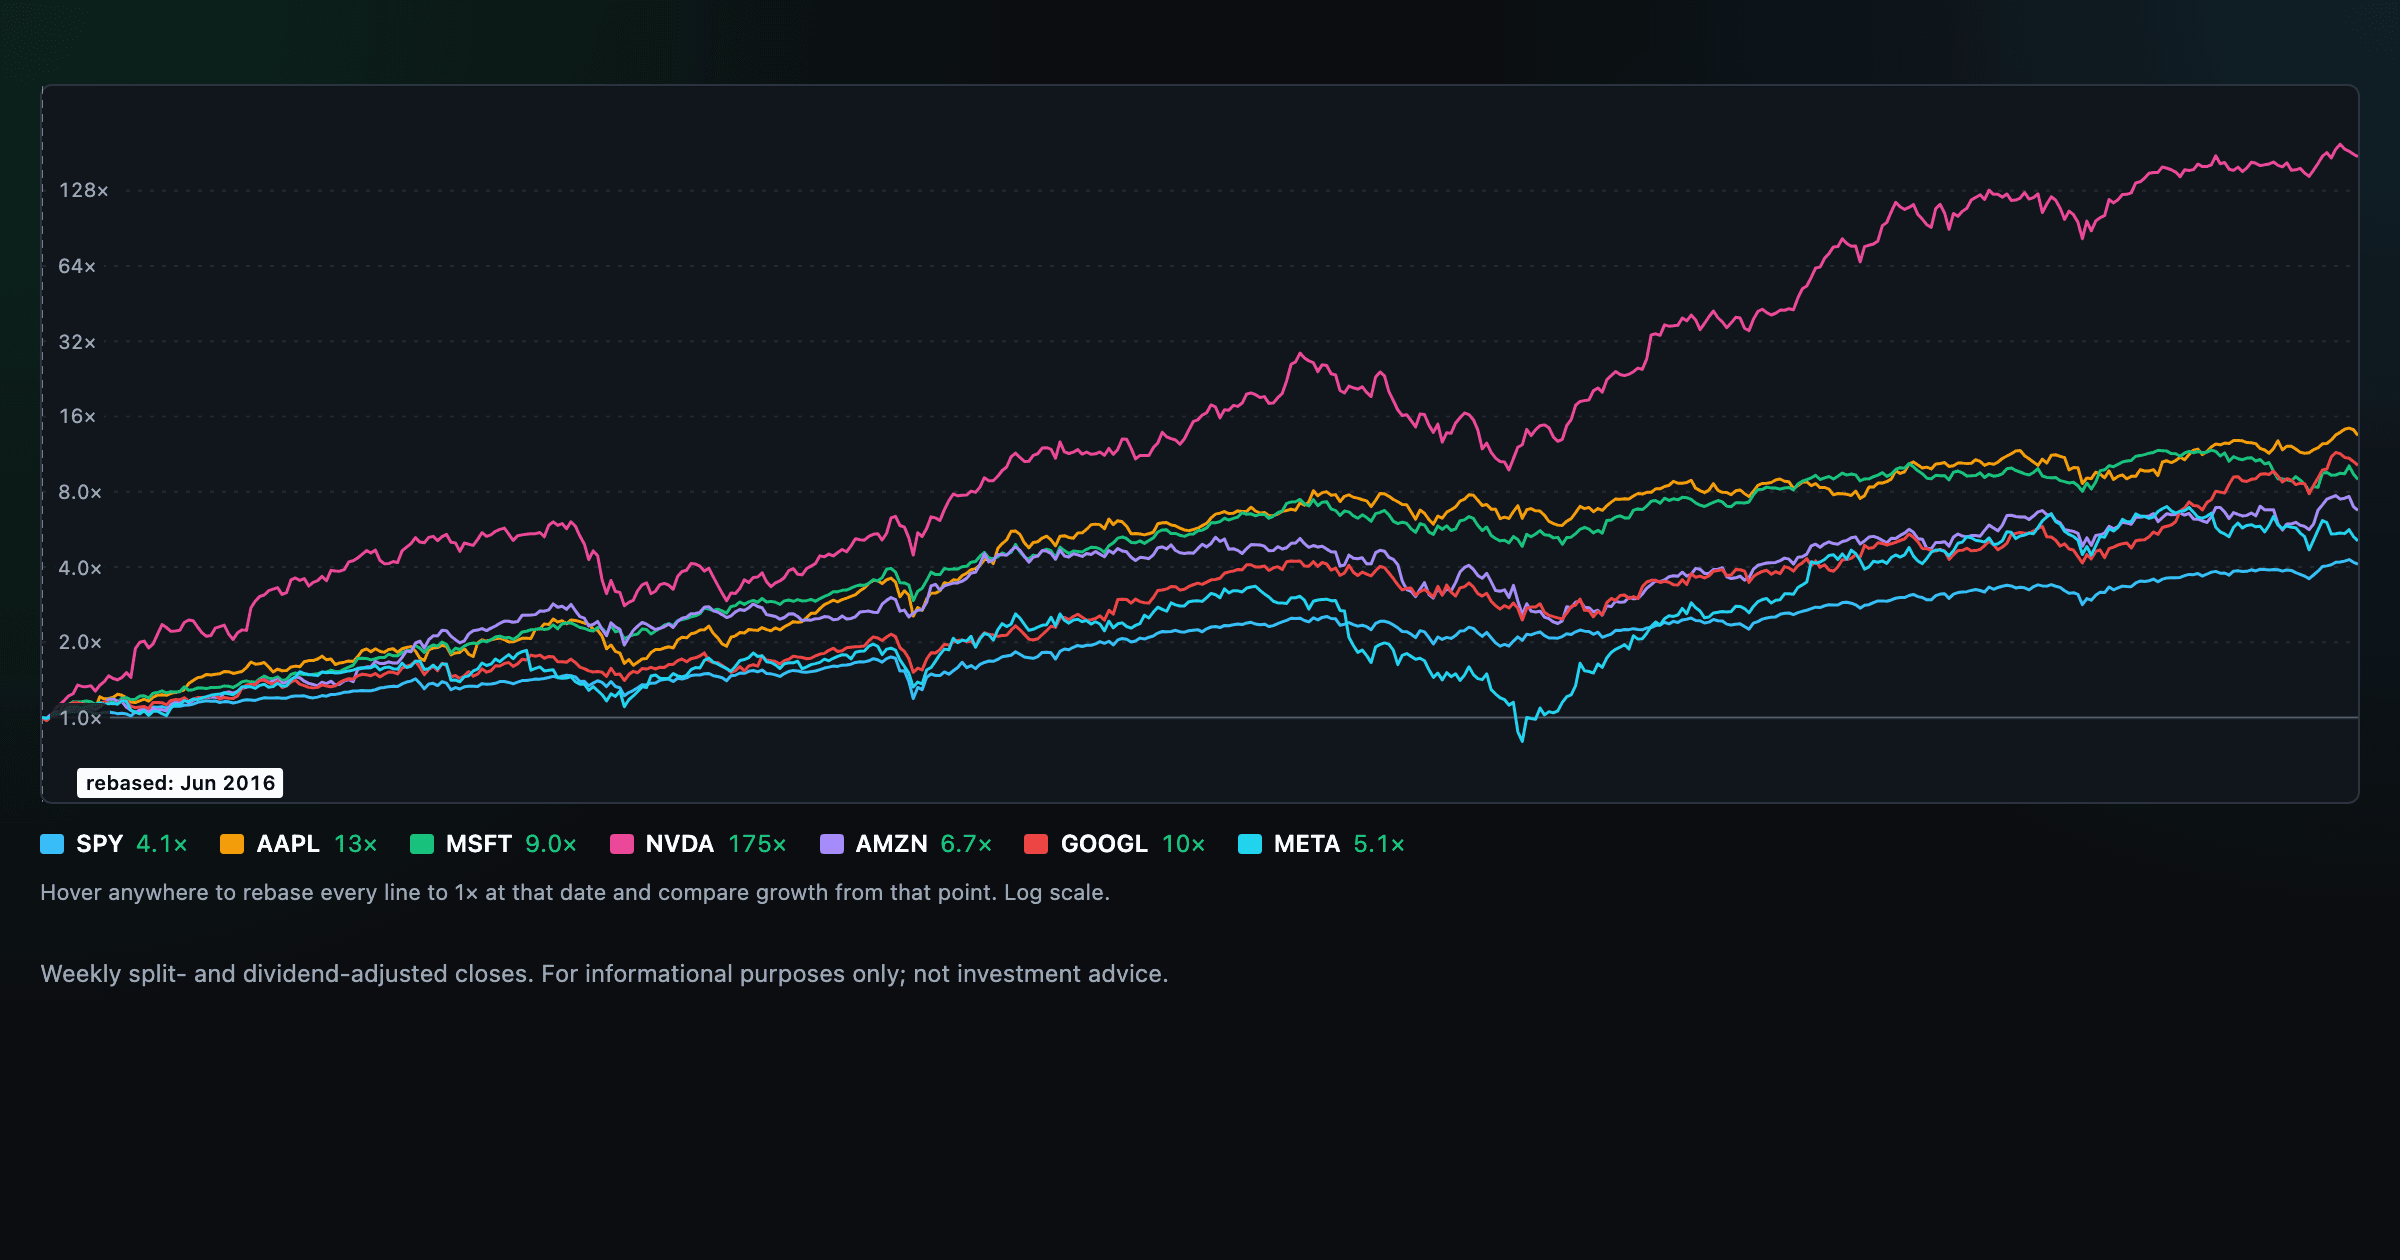
Compare megacaps vs the S&P 500, rebased to 1× at any date you hover.
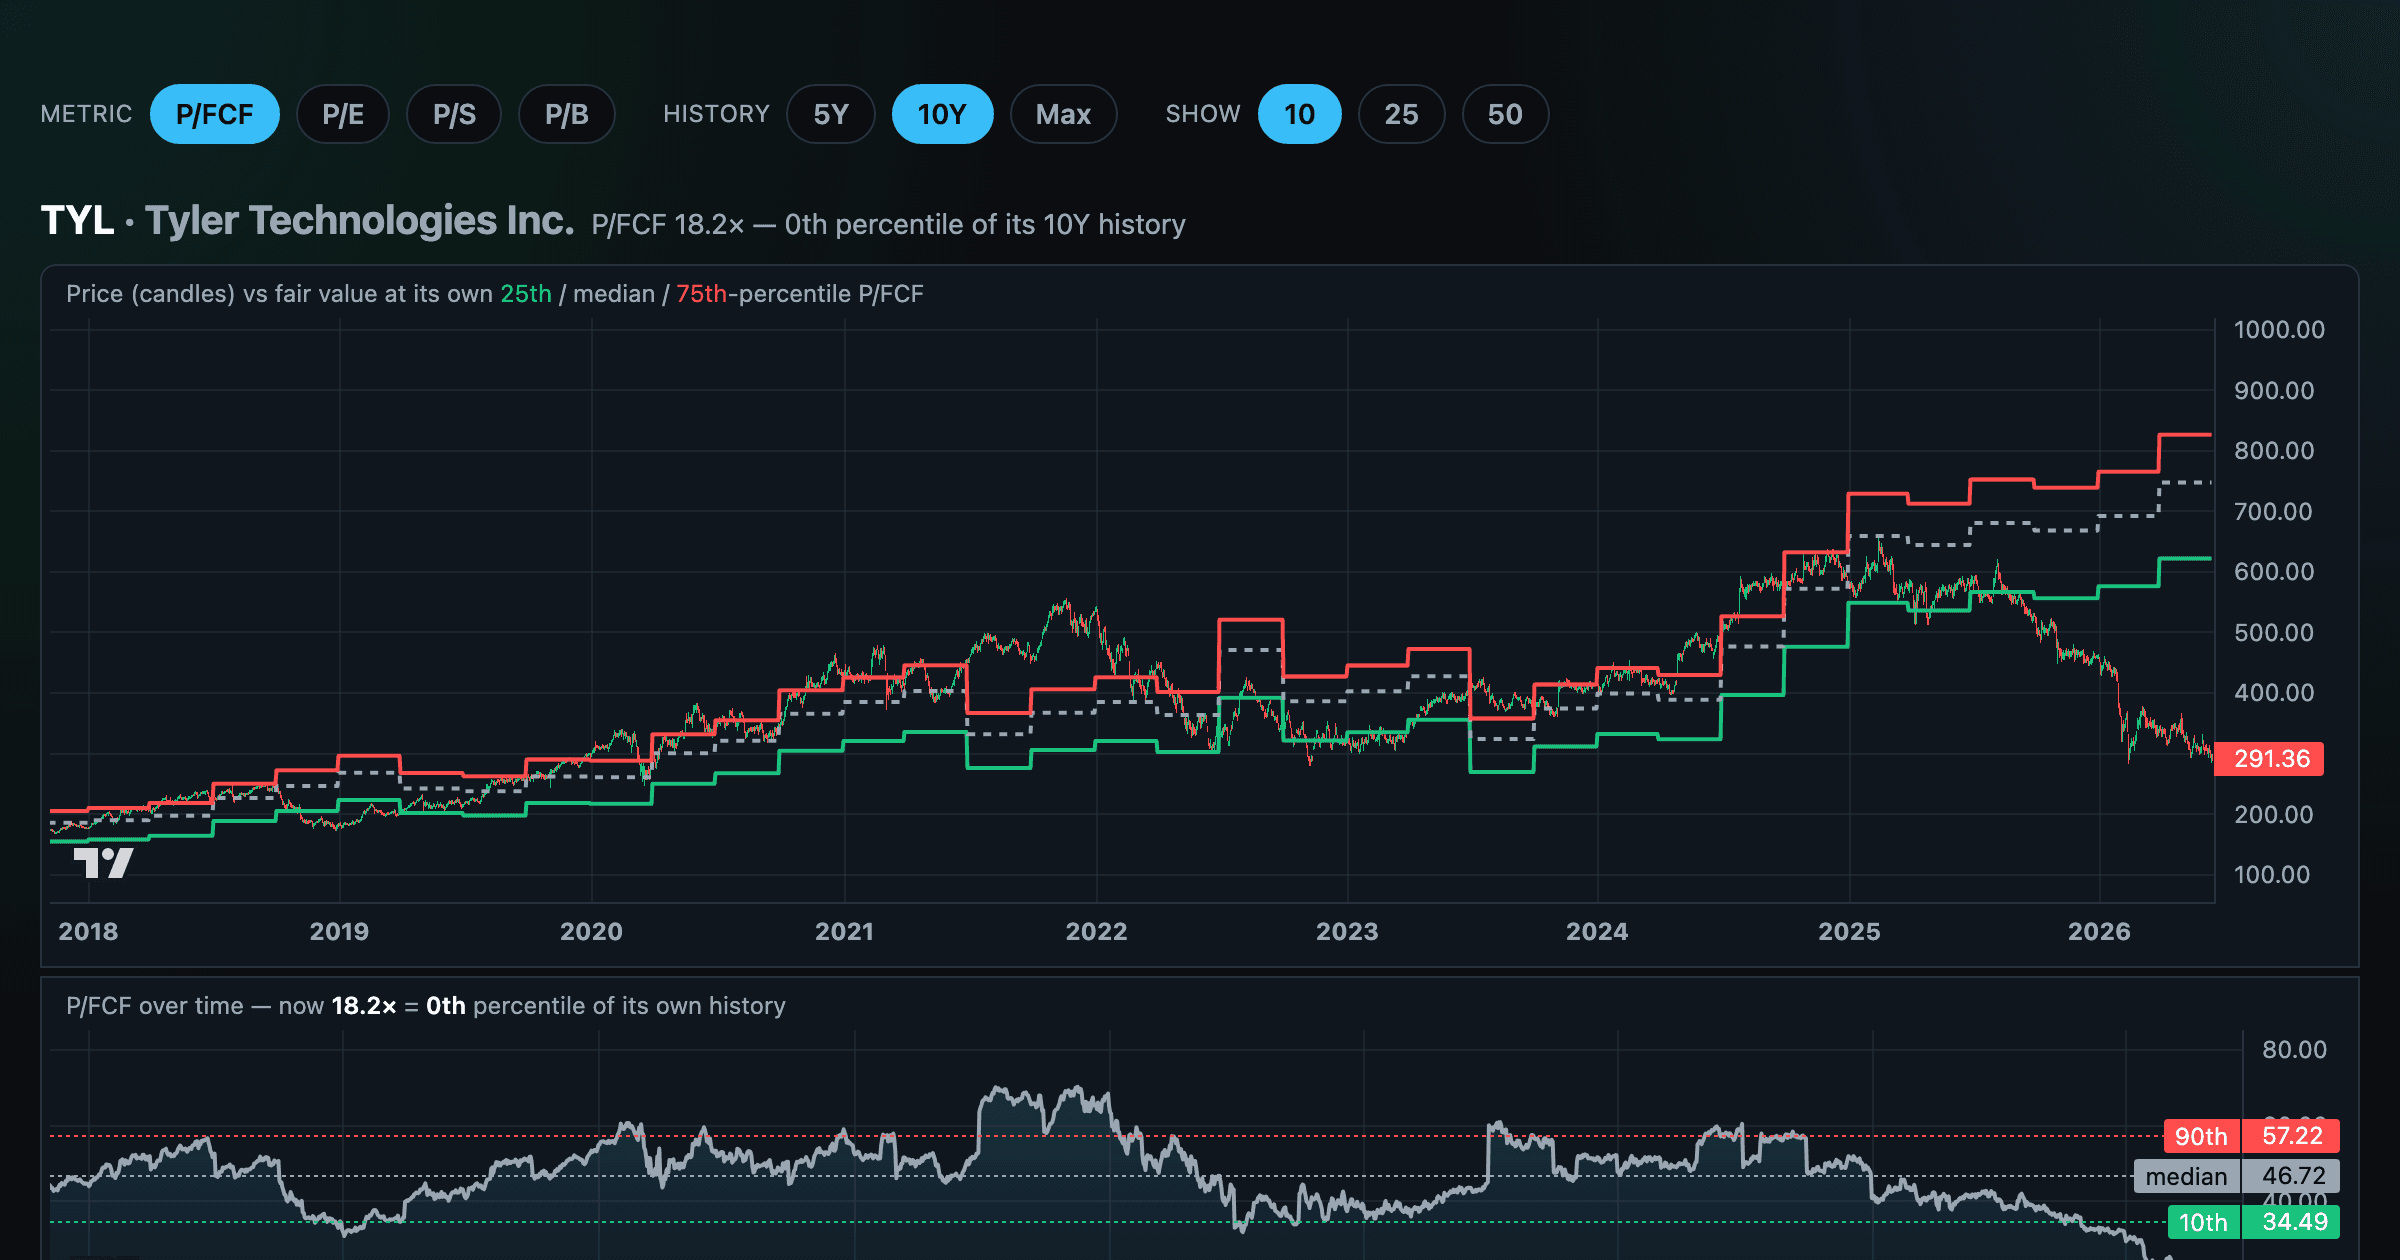
Stocks trading cheapest relative to their own P/E, P/FCF, P/S, or P/B history — with fair-value bands.
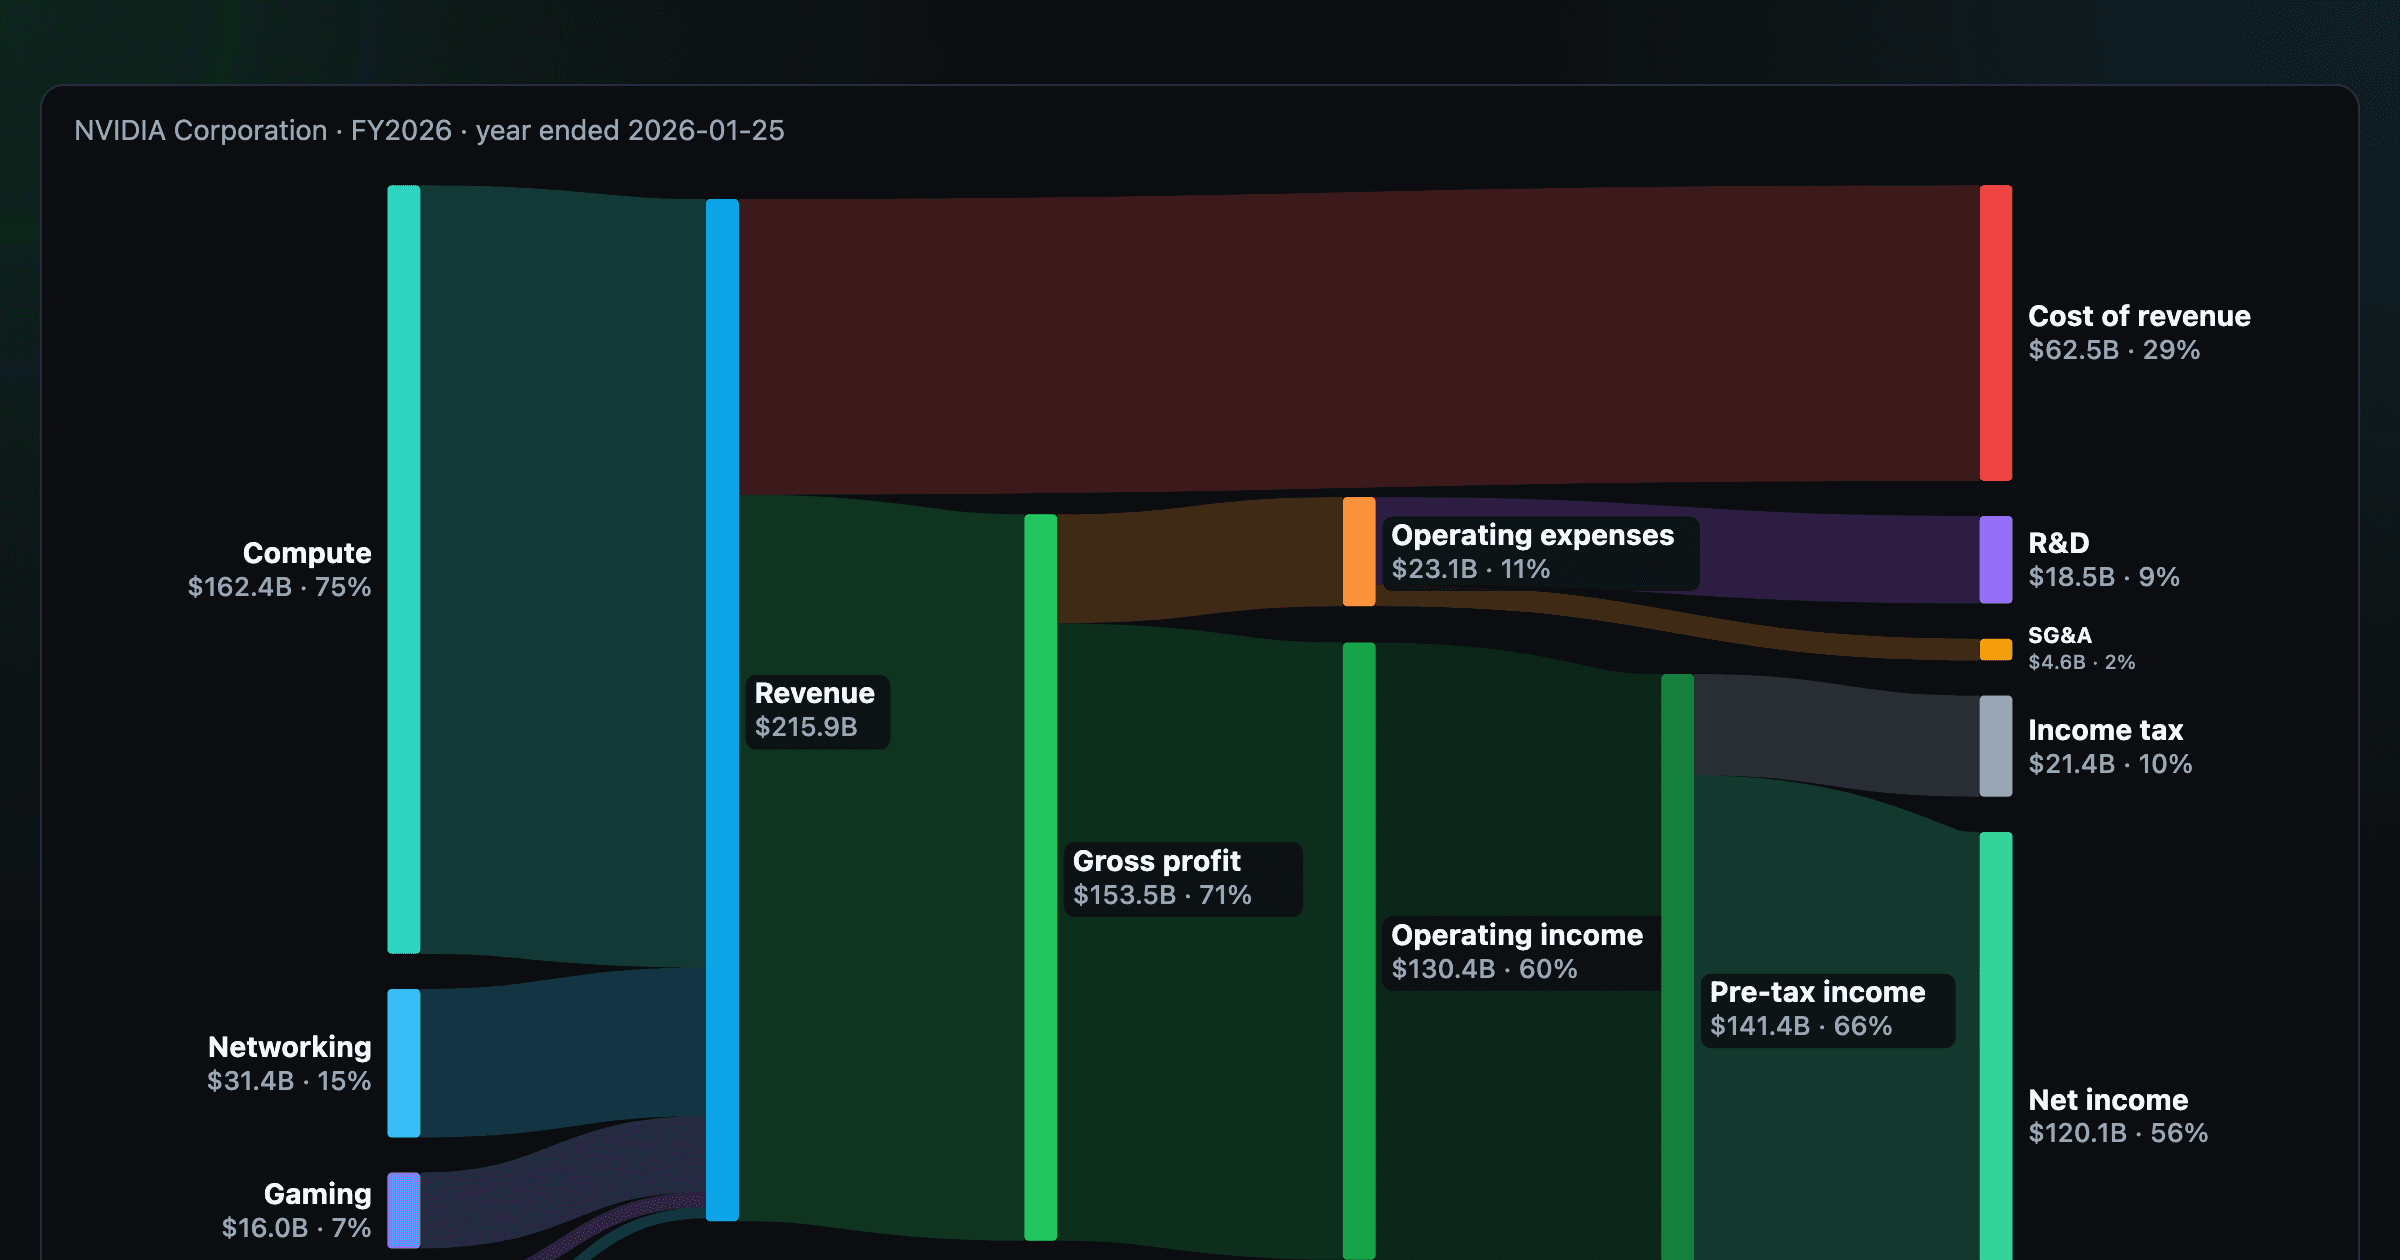
Follow a company's revenue through its income statement as a Sankey — costs, taxes, and profit.
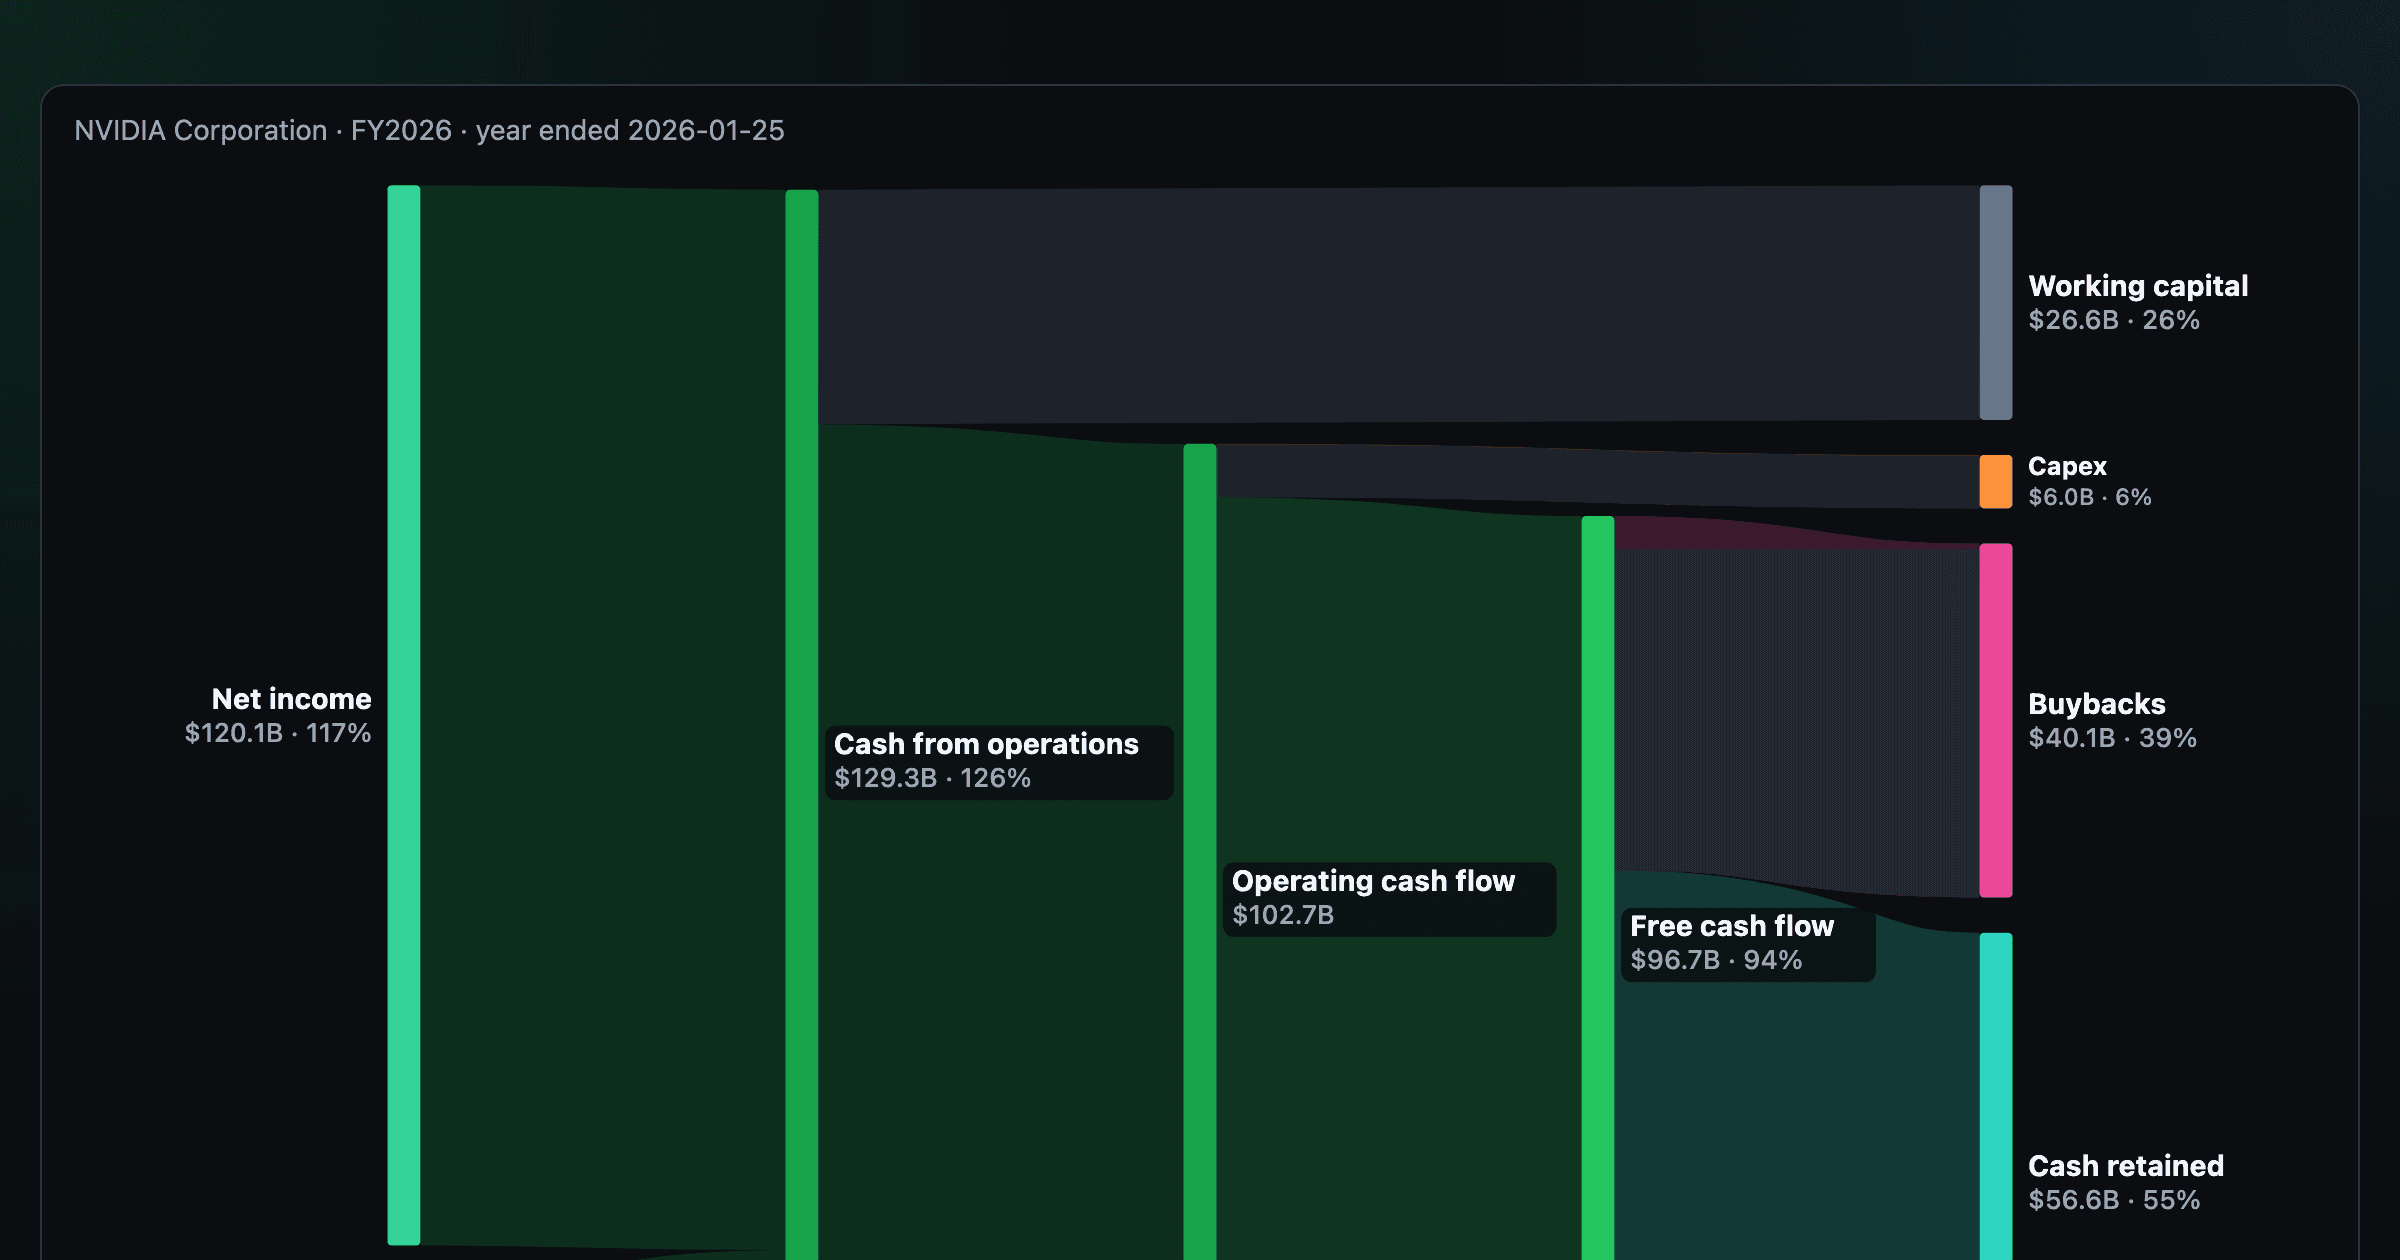
Follow a company's cash from net income through operating cash flow into capex, buybacks, and dividends.
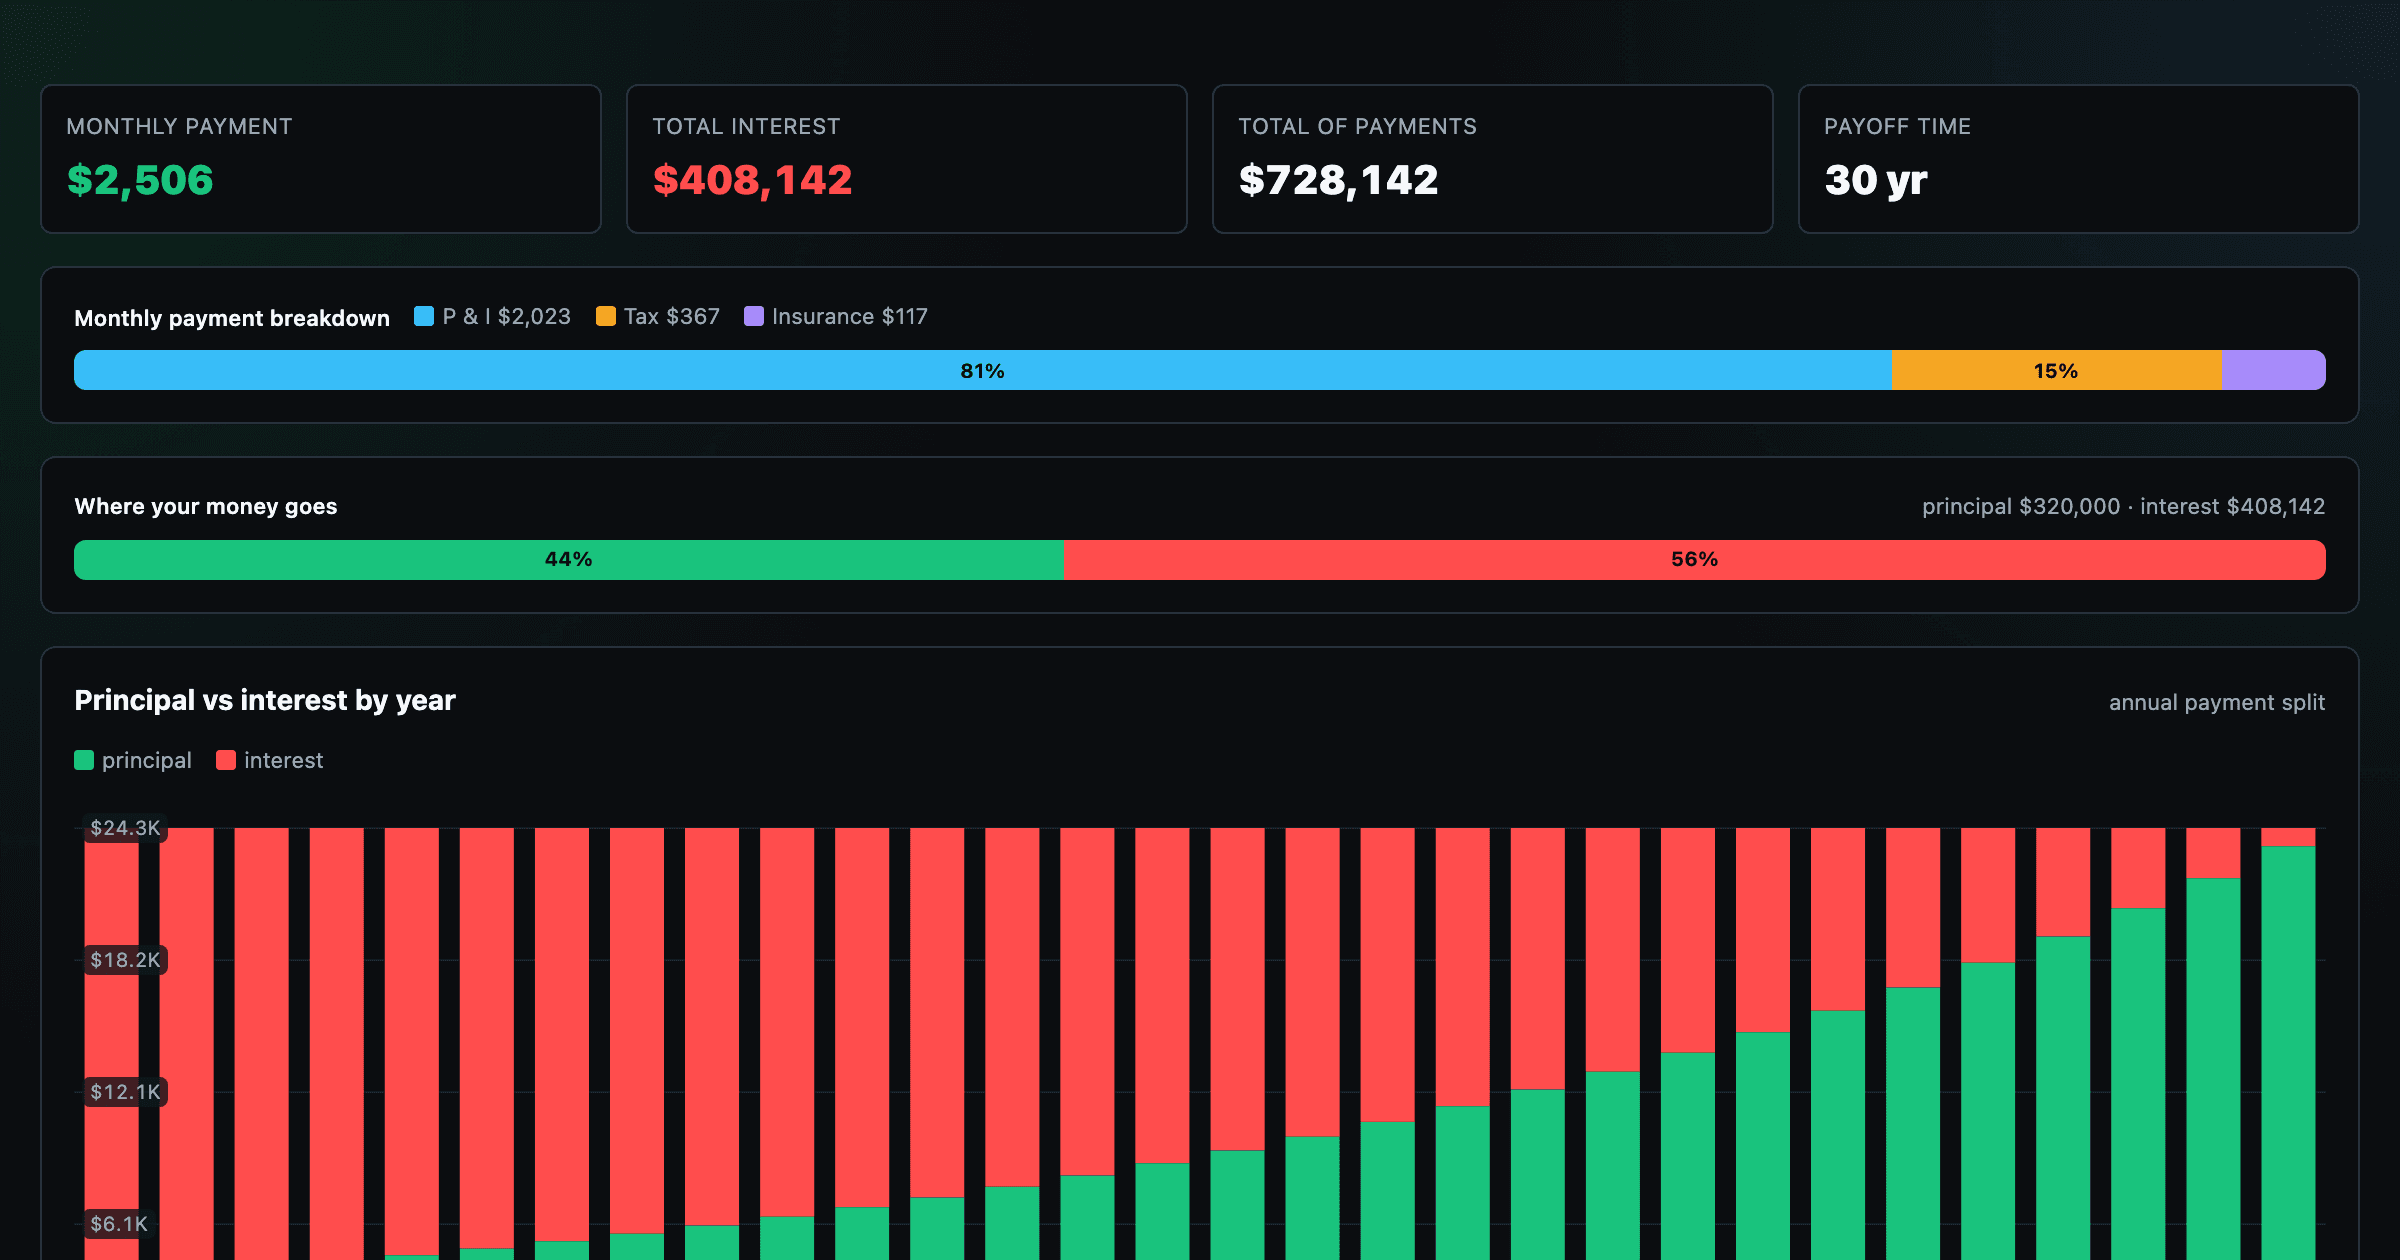
Monthly payment, principal vs interest by year, and the balance paydown — with extra-payment savings.
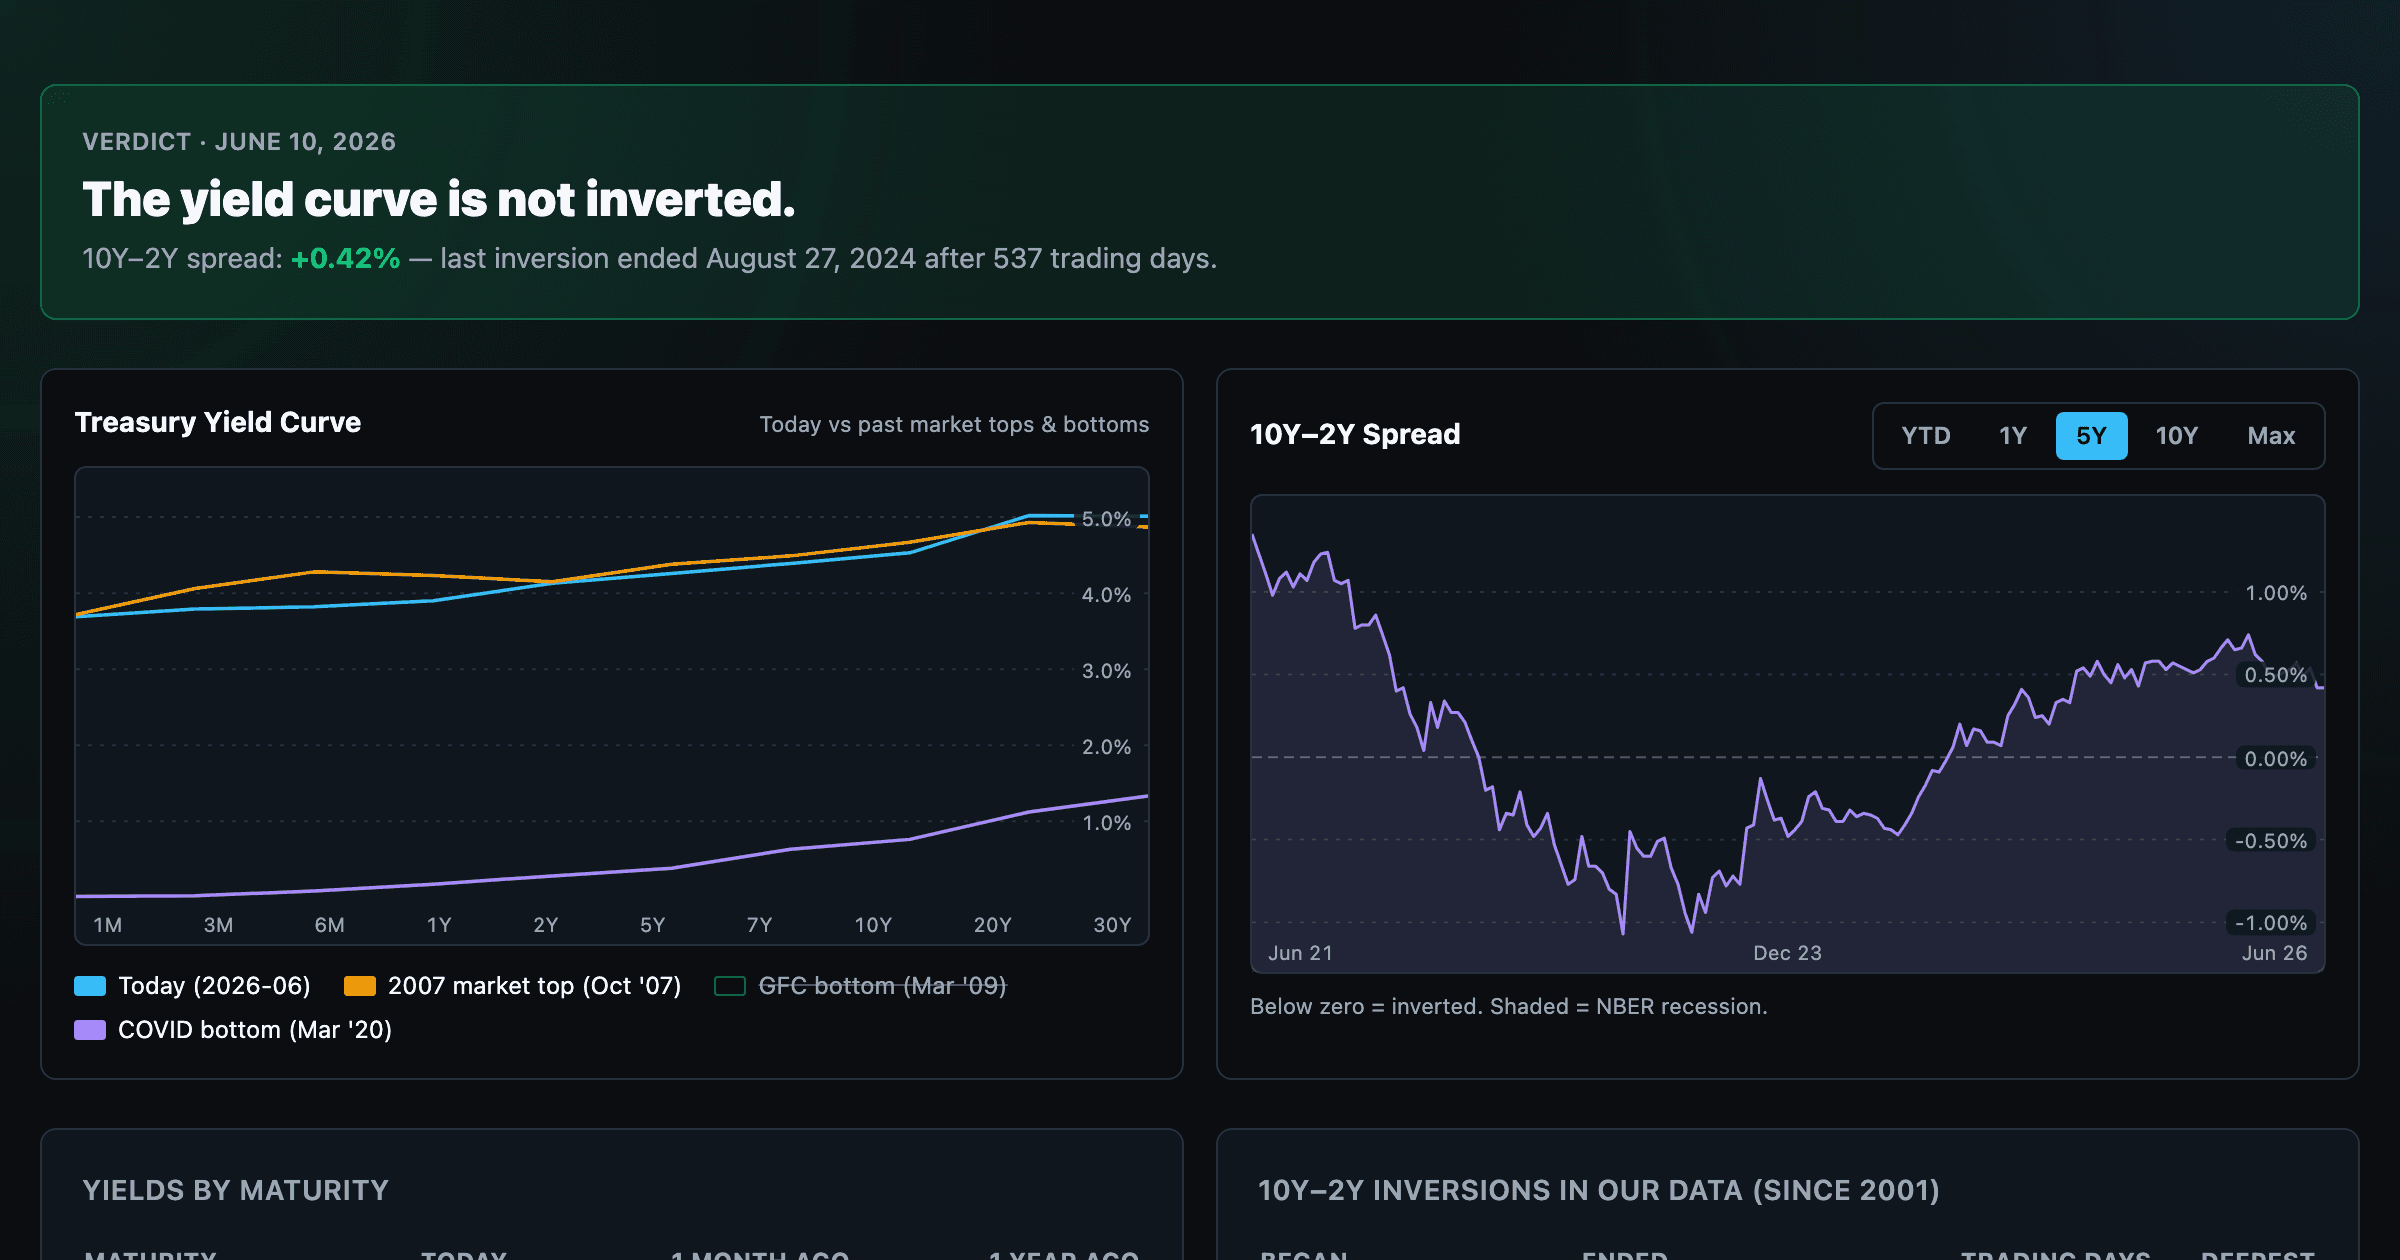
Live term structure, the 10Y–2Y spread, and every inversion episode.